The table below is extracted from Goodland Republic Bureau of Statistics records for 2016 -2017. Use the information to answer the questions that follow. Goodland Economy 2013 and 2018 I tem Price 2017 (Base year) Price 2018_ Price per Unit ($) Production Unit ($) 1.50 2.00 Price per Production 50,000 100,000 50,000 23,000.00 120,000 5,000 Rice ( tons) Wheat (tons) Tractors mid-size (units) Cotton (tons) Used cars Manufacture garments ( tons) Eggs (Trays) Coca Cola (litres) Pepsi Cola (litres) Beef (tons) Second hand cloths (tons) Alcoholic Beverages (litres) Milk (litres) 55,000 2.00 98,000 2.50 45,000 2,450.00 120.00 100.00 5.000.00 110,000 6,000 7,000.00 145,000 2,300 6,500 850 150,000 2,000 6,000 700 5,000 500 500 7,000 50.00 70.00 3.50 1.20 1.50 2.50 0.80 1.10 6.50 4,800 450 600 8.50 15.00 3.25 2.30 25.00 3.75 2.50 7,500 Examine the status of the economic welfare in Goodland Republic in 2018 based on your GDP deflator, nominal GDP and Real GDP. Also, explain the reasons why it is necessary to calculate real GDP. Show your work.
The table below is extracted from Goodland Republic Bureau of Statistics records for 2016 -2017. Use the information to answer the questions that follow. Goodland Economy 2013 and 2018 I tem Price 2017 (Base year) Price 2018_ Price per Unit ($) Production Unit ($) 1.50 2.00 Price per Production 50,000 100,000 50,000 23,000.00 120,000 5,000 Rice ( tons) Wheat (tons) Tractors mid-size (units) Cotton (tons) Used cars Manufacture garments ( tons) Eggs (Trays) Coca Cola (litres) Pepsi Cola (litres) Beef (tons) Second hand cloths (tons) Alcoholic Beverages (litres) Milk (litres) 55,000 2.00 98,000 2.50 45,000 2,450.00 120.00 100.00 5.000.00 110,000 6,000 7,000.00 145,000 2,300 6,500 850 150,000 2,000 6,000 700 5,000 500 500 7,000 50.00 70.00 3.50 1.20 1.50 2.50 0.80 1.10 6.50 4,800 450 600 8.50 15.00 3.25 2.30 25.00 3.75 2.50 7,500 Examine the status of the economic welfare in Goodland Republic in 2018 based on your GDP deflator, nominal GDP and Real GDP. Also, explain the reasons why it is necessary to calculate real GDP. Show your work.

Economics Today and Tomorrow, Student Edition
1st Edition
ISBN:9780078747663
Author:McGraw-Hill
Publisher:McGraw-Hill
Chapter13: Measuring The Economy's Performance
Section: Chapter Questions
Problem 4AA

Related questions
Question
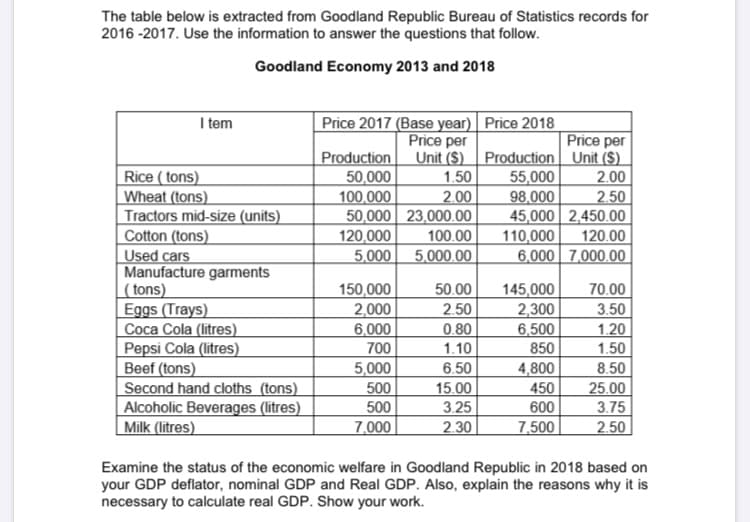
Transcribed Image Text:The table below is extracted from Goodland Republic Bureau of Statistics records for
2016 -2017. Use the information to answer the questions that follow.
Goodland Economy 2013 and 2018
I tem
Price 2017 (Base year) Price 2018_
Price per
Unit ($) Production Unit ($)
1.50
2.00
Price per
Production
50,000
100,000
50,000 23,000.00
120,000
5,000
Rice ( tons)
Wheat (tons)
Tractors mid-size (units)
Cotton (tons)
Used cars
Manufacture garments
( tons)
Eggs (Trays)
Coca Cola (litres)
Pepsi Cola (litres)
Beef (tons)
Second hand cloths (tons)
Alcoholic Beverages (litres)
Milk (litres)
55,000
2.00
98,000
2.50
45,000 2,450.00
120.00
100.00
5.000.00
110,000
6,000 7,000.00
145,000
2,300
6,500
850
150,000
2,000
6,000
700
5,000
500
500
7,000
50.00
70.00
3.50
1.20
1.50
2.50
0.80
1.10
6.50
4,800
450
600
8.50
15.00
3.25
2.30
25.00
3.75
2.50
7,500
Examine the status of the economic welfare in Goodland Republic in 2018 based on
your GDP deflator, nominal GDP and Real GDP. Also, explain the reasons why it is
necessary to calculate real GDP. Show your work.
Expert Solution
This question has been solved!
Explore an expertly crafted, step-by-step solution for a thorough understanding of key concepts.

Step by step
Solved in 3 steps

Knowledge Booster


Learn more about
Need a deep-dive on the concept behind this application? Look no further. Learn more about this topic, economics and related others by exploring similar questions and additional content below.Recommended textbooks for you
Economics Today and Tomorrow, Student Edition
Economics
ISBN:
9780078747663
Author:
McGraw-Hill
Publisher:
Glencoe/McGraw-Hill School Pub Co
Economics Today and Tomorrow, Student Edition
Economics
ISBN:
9780078747663
Author:
McGraw-Hill
Publisher:
Glencoe/McGraw-Hill School Pub Co