
ENGR.ECONOMIC ANALYSIS
14th Edition
ISBN: 9780190931919
Author: NEWNAN
Publisher: Oxford University Press
expand_more
expand_more
format_list_bulleted
Related questions
Question

Transcribed Image Text:X 13.1.69
Question Help
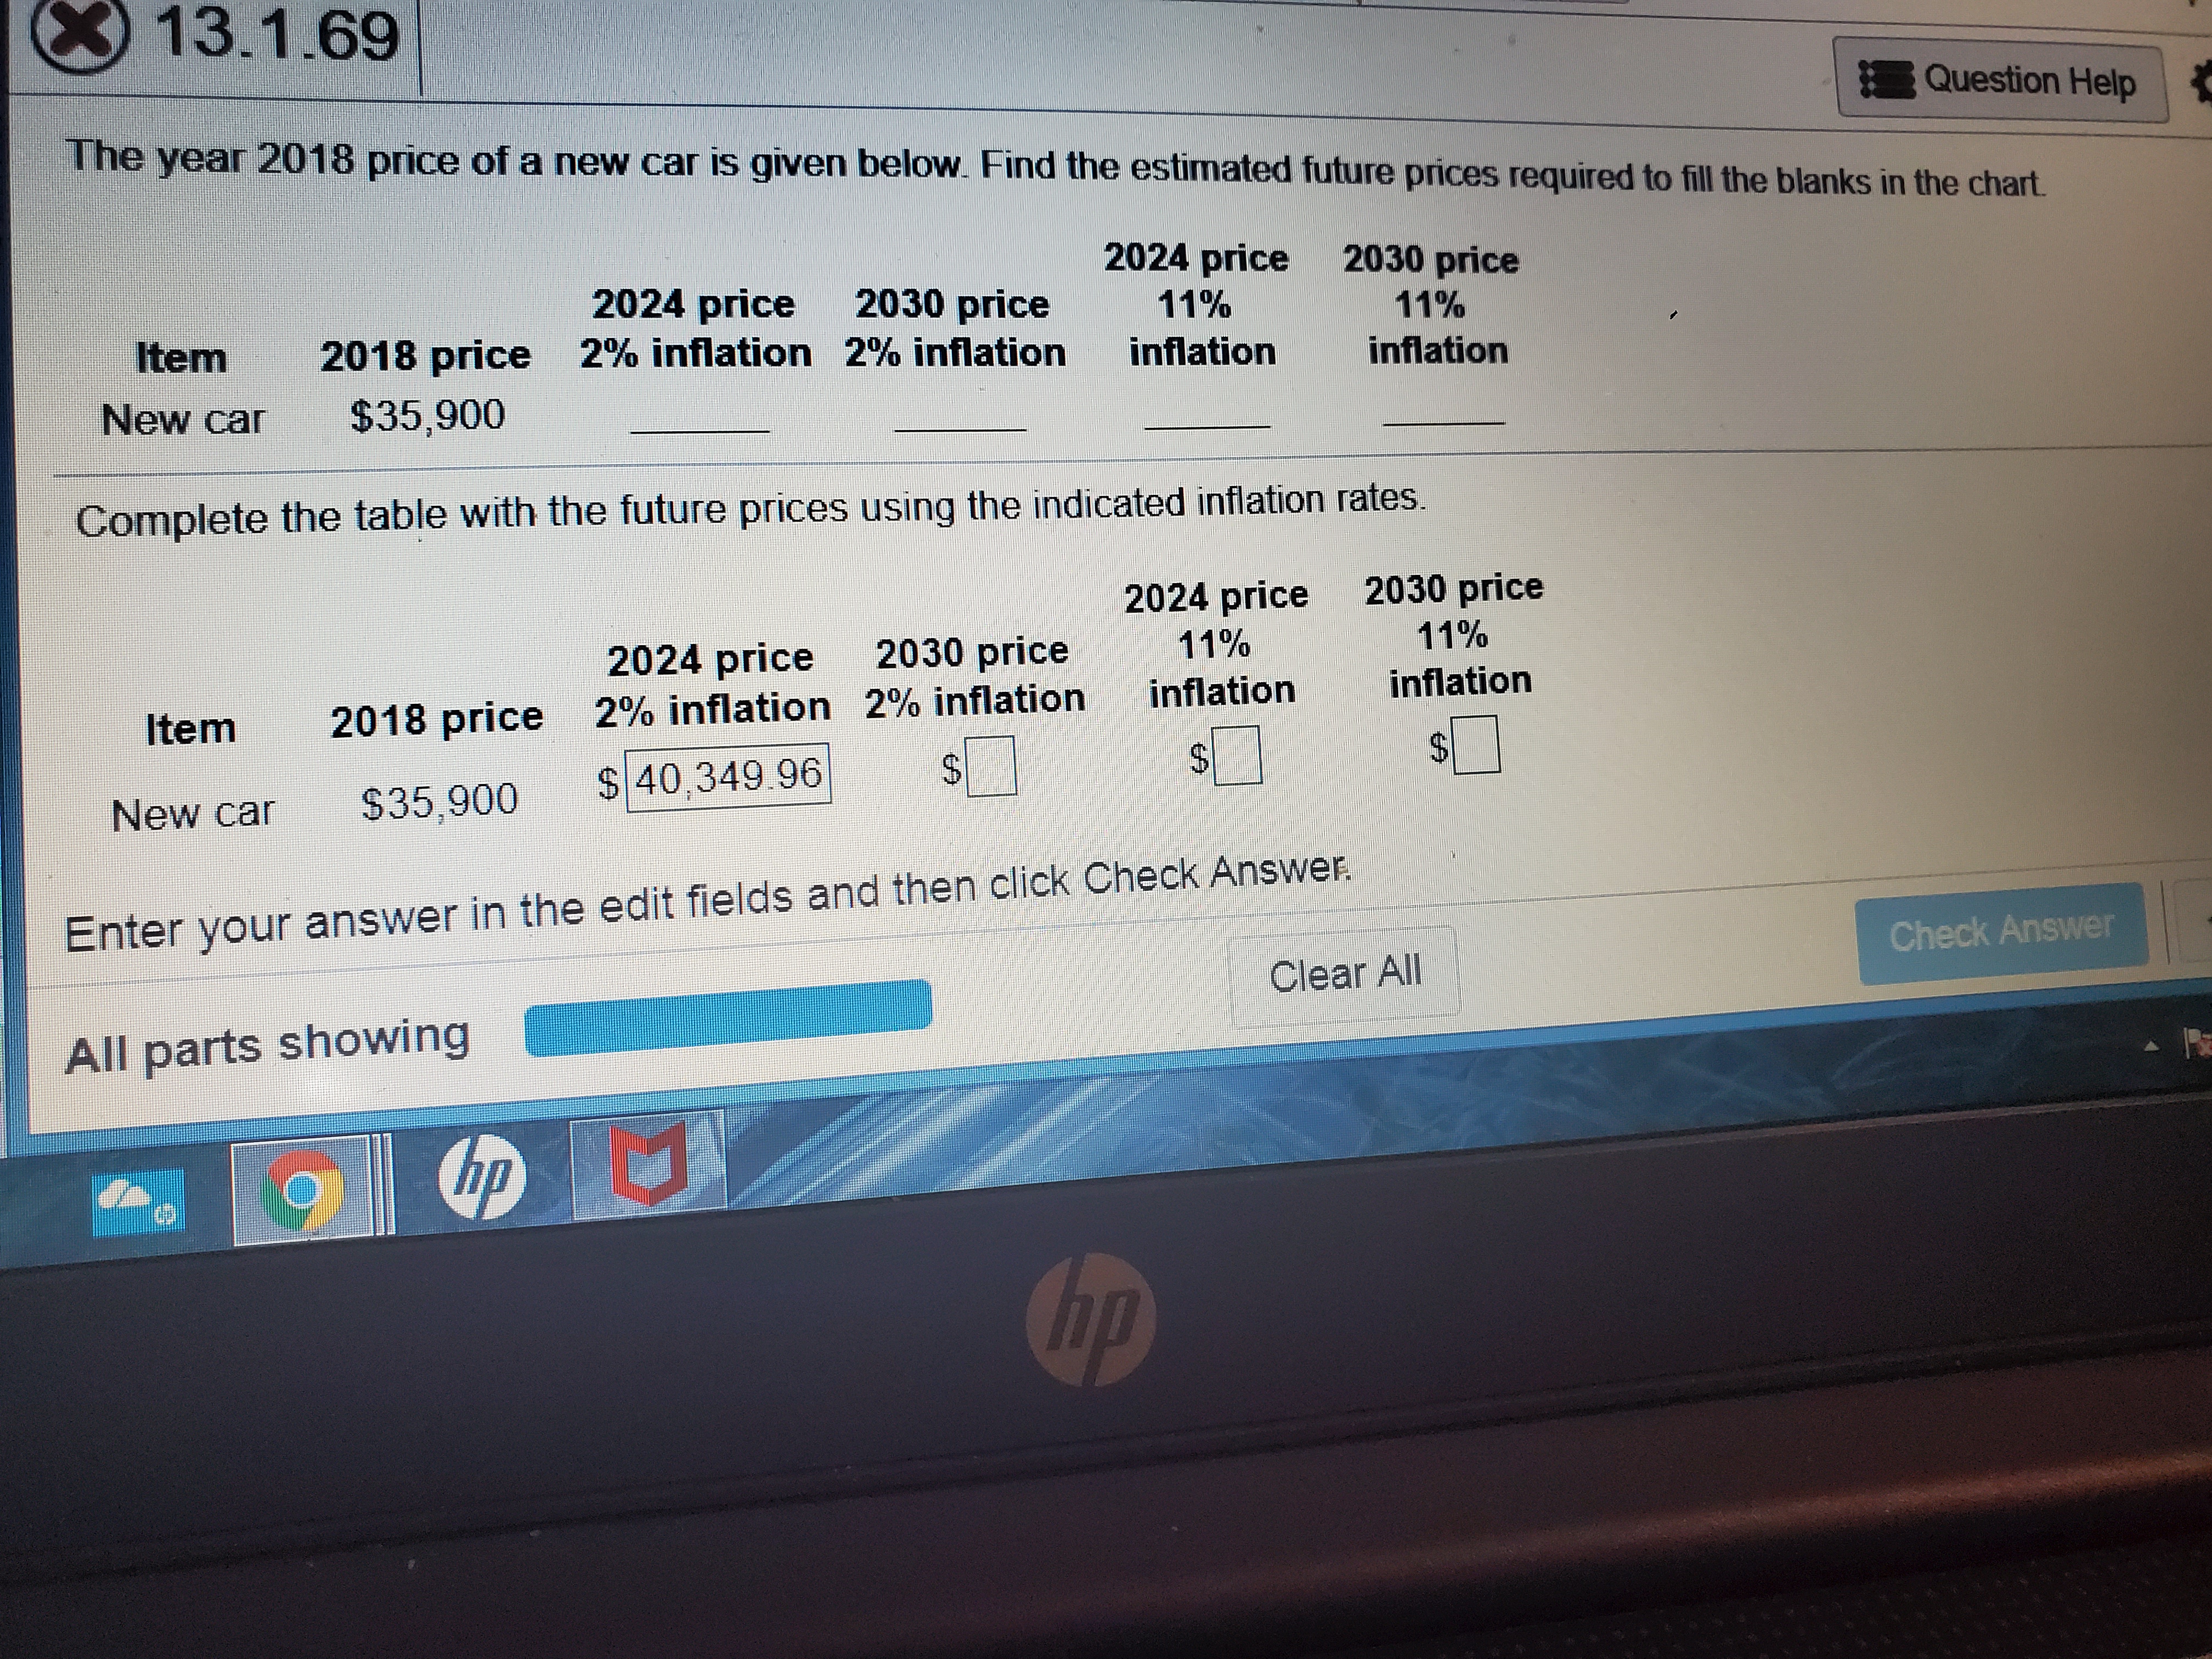
The year 2018 price of a new car is given below. Find the estimated future prices required to fill the blanks in the chart.
2024 price
2030 price
11%
2024 price
2018 price 2% inflation 2% inflation
2030 price
11%
Item
inflation
inflation
New car
$35,900
Complete the table with the future prices using the indicated inflation rates.
2024 price
2030 price
2024 price
2030 price
11%
11%
inflation
inflation
Item
2018 price 2% inflation 2% inflation
$ 40,349.96
24
New car
$35,900
Enter your answer in the edit fields and then click Check Answer.
Clear All
Check Answer
All parts showing
hp
hp
%24
%24
Expert Solution
This question has been solved!
Explore an expertly crafted, step-by-step solution for a thorough understanding of key concepts.

This is a popular solution

Trending nowThis is a popular solution!

Step by stepSolved in 5 steps with 4 images

Knowledge Booster

Similar questions
- b. The price of a product was $0.88 in the year 2008 and $1.28 in the year 2018. What is the average annual inflation rate for this product? (ANSWER CHOICES: 3.82 % or 3.68 % or 3. 98% or 3.42%) c. If the CPI for January 2008 is 208.837 and the CPI for December 2018 is 255.539, what is the average annual inflation rate (per year) from Jan 2008 to Dec 2018? (Hint: Calculate monthly inflation rate and then use annual effective interest rate) (ANSWER CHOICES: 1.75% or 1.85% or 1.95% or 1.65%)arrow_forwardUse the table below to calculate the inflation rate. Year 1 2 WN 3 Price of the Market Basket $1,521 $1,594 $1,691 Using Year 1 as a base year, what is the inflation rate in Year 2? Note:- Do not provide handwritten solution. Maintain accuracy and quality in your answer. Take care of plagiarism. Answer completely. You will get up vote for sure.arrow_forwardYear Raise Starting Salary Ending Salary Absolute Difference in $ from prior year Relative increase from 2012 in % 2018 2% 74636 NA 2019 2% NA 2020 2% NA 2021 2% NA Na na na na na NA na na na na na na Total NA NA NA a. fill in chart b. What is the inflation adjusted value of their 2018 salary in 2020?arrow_forward
- Note: The answer should be typedarrow_forwardTable: Peanut Butter and Jelly Economy Product 2010 Output 2010 Prices (base year) Peanut Butter 200 units Jelly 100 units Select one: Peanut Butter $1.10 per unit $1 per unit 2 per unit Jelly 2.50 per unit What is the inflation rate between 2011 and 2010 (use the deflator as your price index)? a. 12.5% b. 16.67% Product C. 4% d. 31.25% 2011 Output 2011 Prices 250 100arrow_forwardNot sure what’s the correct answer for the second questionarrow_forward
- If the consumer price index is given as 100 in 1992 and in 2004 it is 150, how much inflation occurred during the time period? 50% 100% 150% 5,000%arrow_forward8arrow_forwardThe average rate of inflation in the United States in the last 100 years is approximately 3.26%. In the last year the rate has jumped to 8.5%. Determine the present worth of a future sum of $10,000 in 10 years. Also, determine the present worth of $10,000 10 years ago. Assume time starts when inflation changes from 3.26% to 8.5%. Also assume the 8.5% rate of inflation continues infinitely. Please correct solution and fasterarrow_forward
- Sally will earn $30,000 this year and $40,000 next year. The real interest rate is 20% between this year and next year; she can borrow or lend at this rate. She has no wealth at the start of this year and plans to finish next year having consumed everything she possibly can. She would like to consume the same amount this year as next year. The inflation rate is 0%. (a) How much should Sally save this year? How much will Sally consume in each of the two years? (b) How would your answers change if the real interest rate was 40% ?arrow_forwardYEAR Consumer Price Index 2017 100 2018 110 2019 121 According to the table above, Inflation rate in 2019 is same as the inflation rate in 2018. Is it true or false?i provide an explanation "ouarrow_forwardThe rate of inflation for 2016 was 1.3%. Did the price of Atlanta Braves tickets exceed the inflation rate? Explain. Round percent to nearest tenth.Braves tickets 2015: $19.14Braves tickets 2016: $19.38arrow_forward
arrow_back_ios
SEE MORE QUESTIONS
arrow_forward_ios
Recommended textbooks for you
 Principles of Economics (12th Edition)EconomicsISBN:9780134078779Author:Karl E. Case, Ray C. Fair, Sharon E. OsterPublisher:PEARSON
 Engineering Economy (17th Edition)EconomicsISBN:9780134870069Author:William G. Sullivan, Elin M. Wicks, C. Patrick KoellingPublisher:PEARSON
 Principles of Economics (MindTap Course List)EconomicsISBN:9781305585126Author:N. Gregory MankiwPublisher:Cengage Learning
 Managerial Economics: A Problem Solving ApproachEconomicsISBN:9781337106665Author:Luke M. Froeb, Brian T. McCann, Michael R. Ward, Mike ShorPublisher:Cengage Learning
 Managerial Economics & Business Strategy (Mcgraw-...EconomicsISBN:9781259290619Author:Michael Baye, Jeff PrincePublisher:McGraw-Hill Education
Principles of Economics (12th Edition)
Economics
ISBN:9780134078779
Author:Karl E. Case, Ray C. Fair, Sharon E. Oster
Publisher:PEARSON
Engineering Economy (17th Edition)
Economics
ISBN:9780134870069
Author:William G. Sullivan, Elin M. Wicks, C. Patrick Koelling
Publisher:PEARSON
Principles of Economics (MindTap Course List)
Economics
ISBN:9781305585126
Author:N. Gregory Mankiw
Publisher:Cengage Learning
Managerial Economics: A Problem Solving Approach
Economics
ISBN:9781337106665
Author:Luke M. Froeb, Brian T. McCann, Michael R. Ward, Mike Shor
Publisher:Cengage Learning
Managerial Economics & Business Strategy (Mcgraw-...
Economics
ISBN:9781259290619
Author:Michael Baye, Jeff Prince
Publisher:McGraw-Hill Education