
Related questions
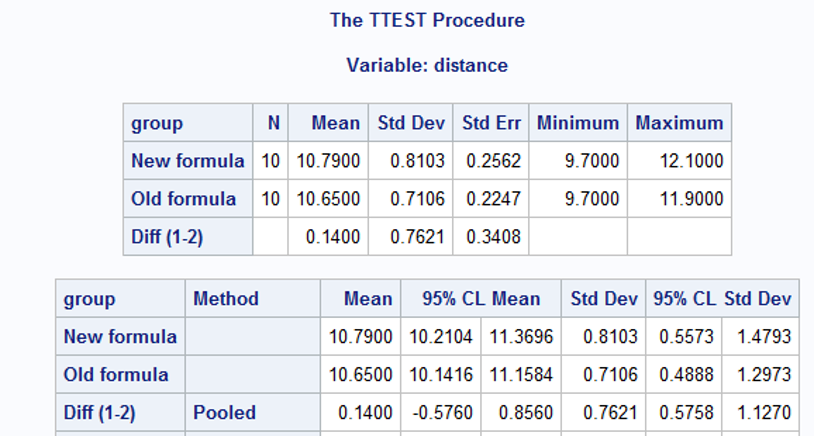
To test a newly formulated protein bar designed to improve running performance, a randomized control trial was deisgn recruiting 20 distance runners. Ten participants were randomly assigned to each group (newly formula protein bar vs old bar). Thirty minutes after consuming the bar the participant ran for 2 hours on a treadmill. The distance each participant ran (in km) in each group was recorded.
The data and SAS output is below
|
Runners on New formula |
Runners on Old formula |
|
10.6 |
10.5 |
|
11.2 |
10.9 |
|
10.3 |
10.2 |
|
11.9 |
11.6 |
|
9.8 |
9.7 |
|
11.1 |
10.8 |
|
12.1 |
11.9 |
|
10.9 |
10.8 |
|
9.7 |
9.8 |
|
10.3 |
10.3 |
a) What is the pooled standard deviation, sp?
b) Find a 95% confidence interval for the population mean difference in run distance for those who eat the newly formulated protein bar compared to the old protein bar.
c) Carry out the appropriate hypothesis test using a two-sided alternative - at a 0.01 significance level.
H0: ________________________________
HA: ________________________________
Test Statistic:
Conclusion in context of the study:
d) Briefly discuss why the conclusions between the two study designs differ (question 2 and question 3), even though the data are exactly the same?


Trending nowThis is a popular solution!

Step by stepSolved in 2 steps with 1 images


- A physical therapist wanted to know whether the mean step pulse of men was less than the mean step pulse of women. She randomly selected 54 men and 70 women to participate in the study. Each subject was required to step up and down a 6-inch platform. The pulse of each subject was then recorded. The following results were obtained. Two sample T for Men vs Women N Mean StDev SE Mean Men Women 98% CI for mu Men - mu Women (- 12.20, - 1.00) T-Test mu Men = mu Women (vs H2 O C. Ho: H1 = H2; Ha: H1 #H2 (b) Identify the P-value and state the researcher's conclusion if the level of significance was a = 0.01. What is the P-value? P-value =arrow_forwardA random selection of volunteers at a research institute have been exposed to a typical cold virus. After they started to have cold symptoms, 10 of them were given multivitamin tablets formulated to fight cold symptoms. The remaining 10 volunteers were given placebo tablets. For each individual, the length of time taken to recover from the cold is recorded. At the end of the experiment the following data are obtained. Days to recover from a cold Treated with multivitamin 2.6, 5.9, 5.3, 5.8, 8.7, 6.2, 7.6, 6.4, 8.0, 4.0 Treated with placebo 3.0, 5.1, 4.7, 4.2, 4.7, 5.6, 5.9, 4.7, 7.1, 4.9 It is known that the population standard deviation of recovery time from a cold is 1.8 days when treated with multivitamin tablets, and the population standard deviation of recovery time from a cold is 1.5 days when treated with placebo tablets. It is also known that both populations are approximately normally distributed. The researchers claim that the mean recovery time, l, of the patients treated…arrow_forwardThe human body is a complex, highly organized structure of cells that work together to accomplish the specific functions necessary for sustaining life. Each human has individual characteristics that uniquely define who they are, but there are characteristics about the human body that have much less variability. One of these is the measurement around the calf muscle's widest part. For this dataset, N = 507 individuals in their twenties and thirties who exercised several hours each week measured around the widest part of both calf muscles and the average maximum girth in centimeters was recorded. We will use this data to get better acquainted with the Empirical Rule. Empirical Rule 68% of data 95% of data 99.7% of data -30 -20 -1o +1o 20 +30 For data that can be reasonably assumed to follow a normal distribution with mean u and standard deviation a, the Empirical Rule can be used to get a sense of where the data values are located in the distribution with regards to the mean. Refer to…arrow_forward
- Since muscle tension in the head region has been associated with tension headaches, a researcher reasoned that if the muscle tension could be changed, perhaps the headaches would also be changed. The researcher designed an experiment in which nine subjects with tension headaches participated. The subjects kept daily logs of the number of headaches they experienced during a 2-week baseline period. Then the researcher trained them to change their muscle tension in the head region, using a biofeedback device. For this experiment, the biofeedback device was connected to a muscle in the forehead region. The device indicated the subject's amount of tension in the muscle to which it was attached and helped them achieve low tension levels. After 6 weeks of training, during which the subjects became successful at maintaining low muscle tension, they again kept a 2-week log of the number of headaches experienced. The following are the number of headaches recorded during each 2-week period.…arrow_forwarduse calculator methodarrow_forwardThe Energy Information Administration reported that 51.7% of homes in the United States were heated by natural gas. A random sample of 198 homes found that 115 were heated by natural gas. Does the evidence support the claim, or has the percentage changed? Useα =0.10 and the P-value method. Use a TI-83 Plus/TI-84 Plusarrow_forward
- Use the Stata output below to answer the following question. The data used in this analysis is from a sample of airlines. The variables used are: fare-avg price of a one-way fare, in dollars dist- distance of the flight, in miles .reg fare ldist. Source Model Residual 551.391705 Total lfare SS ldist _cons 875.094374 df The OLS results suggest that 1 323.702668 120024315 4,594 MS Coef. Std. Err. 4,595 190444913 Number of obs F(1, 4594) Prob > F R-squared Adj R-squared Root MSE t P>|t| .4025646 .0077517 51.93 0.000 2.399834 .0521601 46.01 0.000 4,596 2696.98 0.0000 0.3699 0.3698 .34645 [95% Conf. Intervall .3873676 .4177617 2.297575 2.502093 a 1% increase in distance is associated with approximately a $.40 increase in the price of the fare. a 1% increase in distance is associated with approximately a .40% increase in the price of the fare. a 1% increase in distance is associated with approximately a 40 % increase in the price of the fare. None of the above.arrow_forwardA least squares line for a sample with 11 observations has an SSE = 192; calculate and s. Please show your work So i can understand how you arrived at the answerarrow_forwardA person with tuberculosis is given a chest x-ray. Four tuberculosis x-ray specialists examine each x-ray independently. If each specialist can detect tuberculosis 83% of the time when it is present, what is the probabilty that at least 1 of the specialists will detect a person positive.arrow_forward
- A random sample of size �=662 from a population whose parameter is �=0.77. What is the mean of the distribution of sample proportions? Round the answer accurate to 2 decimal places. What is the standard deviation of the distribution of sample proportions? Round the answer accurate to 2 decimal places.arrow_forwardFor the population, 57% of people are searched if stopped. For a sample of 26441 stops, what Z-test value is calculated given Black men are searched 61% of the time when stopped?arrow_forwardSHOW STEP BY STEP. plsarrow_forward
- MATLAB: An Introduction with ApplicationsStatisticsISBN:9781119256830Author:Amos GilatPublisher:John Wiley & Sons Inc
 Probability and Statistics for Engineering and th...StatisticsISBN:9781305251809Author:Jay L. DevorePublisher:Cengage Learning
 Statistics for The Behavioral Sciences (MindTap C...StatisticsISBN:9781305504912Author:Frederick J Gravetter, Larry B. WallnauPublisher:Cengage Learning
  Elementary Statistics: Picturing the World (7th E...StatisticsISBN:9780134683416Author:Ron Larson, Betsy FarberPublisher:PEARSON
 The Basic Practice of StatisticsStatisticsISBN:9781319042578Author:David S. Moore, William I. Notz, Michael A. FlignerPublisher:W. H. Freeman
 Introduction to the Practice of StatisticsStatisticsISBN:9781319013387Author:David S. Moore, George P. McCabe, Bruce A. CraigPublisher:W. H. Freeman