The volatility of a stock is often measured by its beta value. More information about beta values is provided below. The table below gives beta values for five stocks. Complete (a) and (b). Company А В с D E Reta 0.42 0.79 1.29 2.66 5.03 Click the icon to view information about the beta value of a stock.
The volatility of a stock is often measured by its beta value. More information about beta values is provided below. The table below gives beta values for five stocks. Complete (a) and (b). Company А В с D E Reta 0.42 0.79 1.29 2.66 5.03 Click the icon to view information about the beta value of a stock.

Linear Algebra: A Modern Introduction
4th Edition
ISBN:9781285463247
Author:David Poole
Publisher:David Poole
Chapter4: Eigenvalues And Eigenvectors
Section4.6: Applications And The Perron-frobenius Theorem
Problem 22EQ

Related questions

Topic Video
Question
Please see attached. Is there a way to interpret using excel?
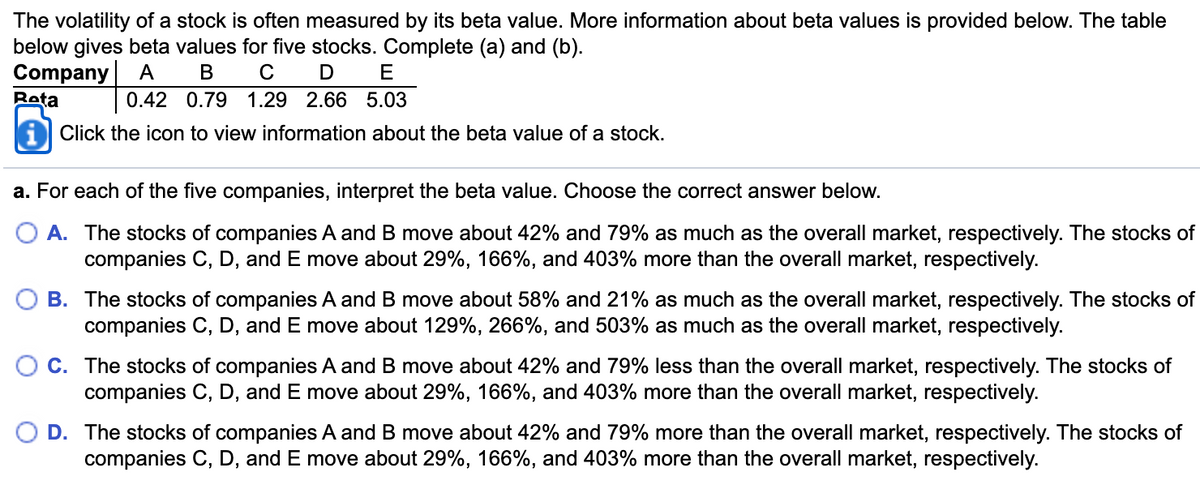
Transcribed Image Text:The volatility of a stock is often measured by its beta value. More information about beta values is provided below. The table
below gives beta values for five stocks. Complete (a) and (b).
Company
Reta
А
B
C
E
0.42 0.79 1.29 2.66 5.03
Click the icon to view information about the beta value of a stock.
a. For each of the five companies, interpret the beta value. Choose the correct answer below.
A. The stocks of companies A and B move about 42% and 79% as much as the overall market, respectively. The stocks of
companies C, D, and E move about 29%, 166%, and 403% more than the overall market, respectively.
B. The stocks of companies A and B move about 58% and 21% as much as the overall market, respectively. The stocks of
companies C, D, and E move about 129%, 266%, and 503% as much as the overall market, respectively.
O C. The stocks of companies A and B move about 42% and 79% less than the overall market, respectively. The stocks of
companies C, D, and E move about 29%, 166%, and 403% more than the overall market, respectively.
D. The stocks of companies A and B move about 42% and 79% more than the overall market, respectively. The stocks of
companies C, D, and E move about 29%, 166%, and 403% more than the overall market, respectively.
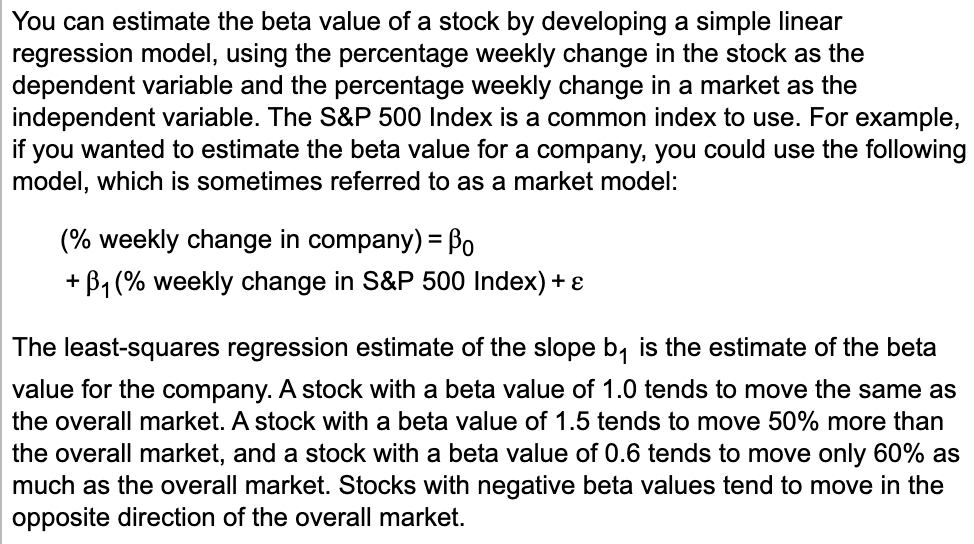
Transcribed Image Text:You can estimate the beta value of a stock by developing a simple linear
regression model, using the percentage weekly change in the stock as the
dependent variable and the percentage weekly change in a market as the
independent variable. The S&P 500 Index is a common index to use. For example,
if you wanted to estimate the beta value for a company, you could use the following
model, which is sometimes referred to as a market model:
(% weekly change in company) = Bo
+ B1 (% weekly change in S&P 500 Index) + e
%3D
The least-squares regression estimate of the slope b, is the estimate of the beta
value for the company. A stock with a beta value of 1.0 tends to move the same as
the overall market. A stock with a beta value of 1.5 tends to move 50% more than
the overall market, and a stock with a beta value of 0.6 tends to move only 60% as
much as the overall market. Stocks with negative beta values tend to move in the
opposite direction of the overall market.
Expert Solution
This question has been solved!
Explore an expertly crafted, step-by-step solution for a thorough understanding of key concepts.

This is a popular solution!

Trending now
This is a popular solution!

Step by step
Solved in 2 steps with 1 images

Knowledge Booster


Learn more about
Need a deep-dive on the concept behind this application? Look no further. Learn more about this topic, statistics and related others by exploring similar questions and additional content below.Recommended textbooks for you
Linear Algebra: A Modern Introduction
Algebra
ISBN:
9781285463247
Author:
David Poole
Publisher:
Cengage Learning

Glencoe Algebra 1, Student Edition, 9780079039897…
Algebra
ISBN:
9780079039897
Author:
Carter
Publisher:
McGraw Hill

Big Ideas Math A Bridge To Success Algebra 1: Stu…
Algebra
ISBN:
9781680331141
Author:
HOUGHTON MIFFLIN HARCOURT
Publisher:
Houghton Mifflin Harcourt
Linear Algebra: A Modern Introduction
Algebra
ISBN:
9781285463247
Author:
David Poole
Publisher:
Cengage Learning
Glencoe Algebra 1, Student Edition, 9780079039897…
Algebra
ISBN:
9780079039897
Author:
Carter
Publisher:
McGraw Hill
Big Ideas Math A Bridge To Success Algebra 1: Stu…
Algebra
ISBN:
9781680331141
Author:
HOUGHTON MIFFLIN HARCOURT
Publisher:
Houghton Mifflin Harcourt