
MATLAB: An Introduction with Applications
6th Edition
ISBN: 9781119256830
Author: Amos Gilat
Publisher: John Wiley & Sons Inc
expand_more
expand_more
format_list_bulleted
Related questions
Question
thumb_up100%
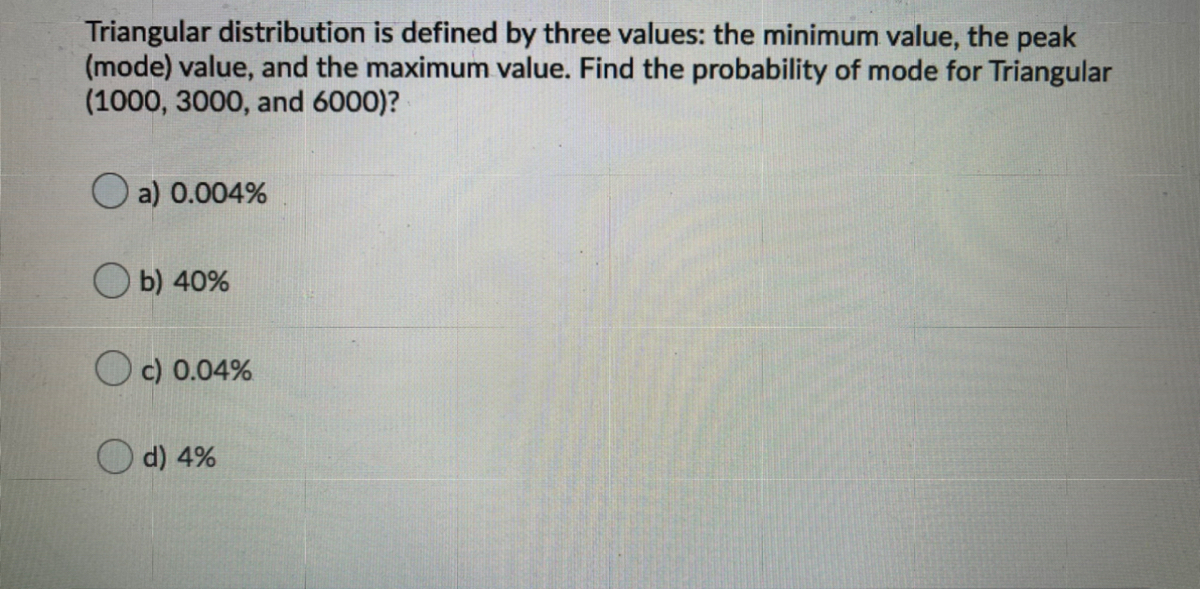

Transcribed Image Text:Triangular distribution is defined by three values: the minimum value, the peak
(mode) value, and the maximum value. Find the probability of mode for Triangular
(1000, 3000, and 6000)?
O a) 0.004%
b) 40%
O c) 0.04%
d) 4%
Expert Solution
This question has been solved!
Explore an expertly crafted, step-by-step solution for a thorough understanding of key concepts.

This is a popular solution

Trending nowThis is a popular solution!

Step by stepSolved in 2 steps

Knowledge Booster

Similar questions
- The odds on (i.e. odds against) TripleTreat winning the Kentucky Derby are 7 to 2. This means the bookmaker estimates TripleTreat's probability of winning is:arrow_forwardUse the given odds to determine the probability of the underlined event. odds against exposure to excessive natural cold: odds against exposure 6,045 to 1 The probability of exposure to natural cold is ?arrow_forwardFind the probability (in percent) when randomly drawing from a hat containing twenty-six cards, each with a different letter of the alphabet. Probability of drawing exactly two voles (a, e, i, o, or u) in five draws if each card drawn is replacedarrow_forward
- In Vancouver, Canada the probability of rain during a fall-winter day (FW) is 0.58, and during a spring- summer day (SS) the probability of rain is 0.25. For this problem, consider the probability of a day being either fall-winter (FW) or spring-summer (SS) in Vancouver as equal (0.5) during the year. Use this information to fill out the following probability tree; for each number on the tree branches or end points, write the corresponding probability for that branch or end point on the answer sheet: seasons SS (17) FW (18) weather not rainy (19) rainy (20) not rainy (21) rainy (22) combination SS & not raining (23) SS & rainy (24) FW & not rainy (25) FW & rainy (26) 27) On any given day of the whole year, what is the probability of it being rainy in Vancouver? 28) On any given day of the whole year, what is the probability of it not being rainy in Vancouver? 29) What is the name for the type of probabilities that are used in the second column of branches (weather) of this probability…arrow_forwardGiving a test to a group of students, the grades and gender are summarized below A B C Total Male 3 9 12 24 Female 13 18 20 51 Total 16 27 32 75 If one student is chosen at random,a) Find the probability that the student got a C: b) Find the probability that the student was female AND got a "C": c) Find the probability that the student was female OR got an "C": d) If one student is chosen at random, find the probability that the student got a 'B' GIVEN they are female:arrow_forwardClassify the probability distribution of each problem? Then solve. Question 1 The mean number of citizens voting in one of the provinces on the election day is 10 per hour. Find the probability that in the next hour there will be: a) Exactly 12 citizens showed up to vote. b) Between 9 and 12 citizens showed up to vote. c) At least 3 citizens showed up to vote. d) Find the mean and standard deviation of number of citizens voting in one of the provinces on the election day. Question 2 When conducting a research on males, showed that 0.287 have color blindness. A researcher forms random group of five males. The random variable X is the number of males in the group who have a form of color blindness. Find the probability a) 4 males have color blindness. b) More than 3 males have color blindness. c) Less than 3 males have color blindness. d) Find the mean and standard deviation of males have color blindness. Question 3. The Higher Education Research Institute at UCLA collected data from…arrow_forward
- Use the data in the following table, which lists drive-thru order accuracy at popular fast food chains. Assume that orders are randomly selected from those included in the table. Drive-thru Restaurant O A B 276 54 C 234 30 D Order Accurate 328 120 Order Not Accurate 34 11 If three different orders are selected, find the probability that they are all from Restaurant B.arrow_forwardUse the data in the following table, which lists drive-thru order accuracy at popular fast food chains. Assume that orders are randomly selected from those included in the table. Drive-thru Restaurant A B C D Order Accurate 314 277 244 131 Order Not Accurate 33 51 34 18 If three different orders are selected, find the probability that they are all from restaurant D.arrow_forwardSub part d and earrow_forward
- A spinner is divided into five colored sections that are not of equal size: red, blue, green, yellow, and purple. The spinner is spun several times, and the results are recorded below: Spinner Results Color Frequency Red 3 Blue 2 Green 14 Yellow 13 Purple 7 Based on these results, express the probability that the next spin will land on red as a percent to the nearest whole number.arrow_forwardUse the data in the following table, which lists drive-thru order accuracy at popular fast food chains. Assume that orders are randomly selected from those included in the table. Drive-thru Restaurant A B C D Order Accurate 339 279 244 133 Order Not Accurate 35 53 33 10 If three different orders are selected, find the probability that they are all from restaurant D.arrow_forwardUse the data in the following table, which lists drive-thru order accuracy at popular fast food chains. Assume that orders are randomly selected from those included in the table. Drive-thru Restaurant A B C D Order Accurate 324 275 234 136 Order Not Accurate 36 52 34 12 If one order is selected, find the probability of getting an order that is not accurate. The probability of getting an order that is not accurate is nothingarrow_forward
arrow_back_ios
SEE MORE QUESTIONS
arrow_forward_ios
Recommended textbooks for you
- MATLAB: An Introduction with ApplicationsStatisticsISBN:9781119256830Author:Amos GilatPublisher:John Wiley & Sons Inc
 Probability and Statistics for Engineering and th...StatisticsISBN:9781305251809Author:Jay L. DevorePublisher:Cengage Learning
 Statistics for The Behavioral Sciences (MindTap C...StatisticsISBN:9781305504912Author:Frederick J Gravetter, Larry B. WallnauPublisher:Cengage Learning
  Elementary Statistics: Picturing the World (7th E...StatisticsISBN:9780134683416Author:Ron Larson, Betsy FarberPublisher:PEARSON
 The Basic Practice of StatisticsStatisticsISBN:9781319042578Author:David S. Moore, William I. Notz, Michael A. FlignerPublisher:W. H. Freeman
 Introduction to the Practice of StatisticsStatisticsISBN:9781319013387Author:David S. Moore, George P. McCabe, Bruce A. CraigPublisher:W. H. Freeman
MATLAB: An Introduction with Applications
Statistics
ISBN:9781119256830
Author:Amos Gilat
Publisher:John Wiley & Sons Inc
Probability and Statistics for Engineering and th...
Statistics
ISBN:9781305251809
Author:Jay L. Devore
Publisher:Cengage Learning
Statistics for The Behavioral Sciences (MindTap C...
Statistics
ISBN:9781305504912
Author:Frederick J Gravetter, Larry B. Wallnau
Publisher:Cengage Learning
Elementary Statistics: Picturing the World (7th E...
Statistics
ISBN:9780134683416
Author:Ron Larson, Betsy Farber
Publisher:PEARSON
The Basic Practice of Statistics
Statistics
ISBN:9781319042578
Author:David S. Moore, William I. Notz, Michael A. Fligner
Publisher:W. H. Freeman
Introduction to the Practice of Statistics
Statistics
ISBN:9781319013387
Author:David S. Moore, George P. McCabe, Bruce A. Craig
Publisher:W. H. Freeman