
MATLAB: An Introduction with Applications
6th Edition
ISBN: 9781119256830
Author: Amos Gilat
Publisher: John Wiley & Sons Inc
expand_more
expand_more
format_list_bulleted
Related questions
Concept explainers
Topic Video
Question
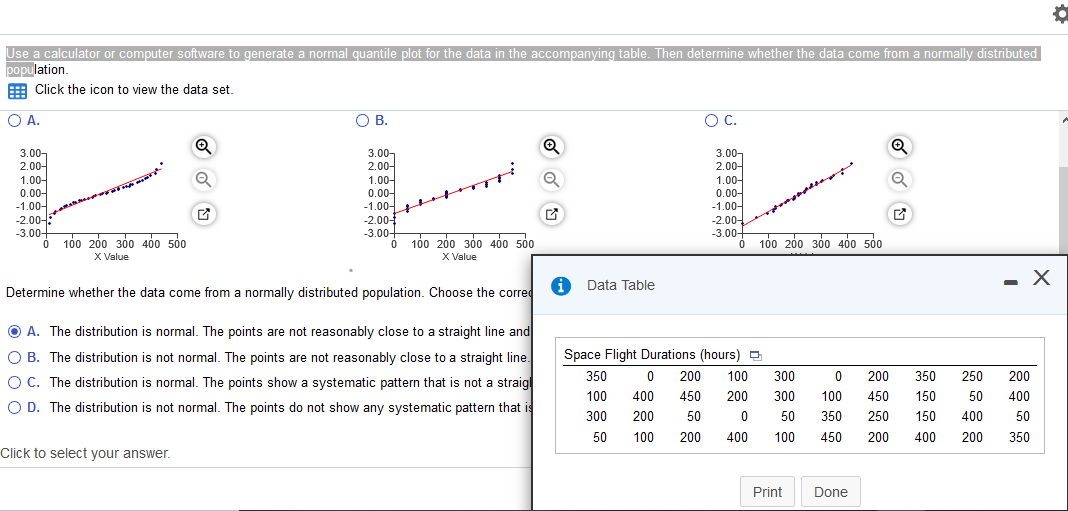

Transcribed Image Text:Use a calculator or computer software to generate a normal quantile plot for the data in the accompanying table. Then determine whether the data come from a normally distributed
population.
Click the icon to view the data set.
O A.
OB.
В.
OC.
OC.
3.00-
2.00-
3.00-
3.00-
2.00-
1.00-
0.00-
-1.00-
-2.00-
-3.00+
2.00-
1.00-
0.00-
-1.00-
-2.00-.
-3.00-
1.00-
0.00-
-1.00-
-2.00-
-3.00-
O 100 200 300 400 500
X Value
O 100 200 300 400 500
X Value
O 100 200 300 400 500
i Data Table
- X
Determine whether the data come from a normally distributed population. Choose the corred
O A. The distribution is normal. The points are not reasonably close to a straight line and
O B. The distribution is not normal. The points are not reasonably close to a straight line.
Space Flight Durations (hours) D
350
200
100
300
200
350
250
200
O C. The distribution is normal. The points show a systematic pattern that is not a straigl
100
400
450
200
300
100
450
150
50
400
O D. The distribution is not normal. The points do not show any systematic pattern that is
300
200
50
50
350
250
150
400
50
50
100
200
400
100
450
200
400
200
350
Click to select your answer.
Print
Done
Expert Solution
This question has been solved!
Explore an expertly crafted, step-by-step solution for a thorough understanding of key concepts.

This is a popular solution

Trending nowThis is a popular solution!

Step by stepSolved in 2 steps with 2 images

Knowledge Booster


Learn more about
Need a deep-dive on the concept behind this application? Look no further. Learn more about this topic, statistics and related others by exploring similar questions and additional content below.Similar questions
- Bar charts Select an answer and submit. For keyboard navigation, use the up/down arrow keys to select an answer. a Are preferred to Column Charts when labels are long. Cannot be used for clustered bar charts. Are better than column charts when showing averages. d. Are the basis for Box and Whisker Charts.arrow_forwardRefer to table to answer question.arrow_forwardq26- Which of the following charts shows the five numbers summarising the distribution of a variable in a dataset? a. A boxplot b. A histogram c. A cumulative histogram d. A scatter plotarrow_forward
- Answer the questions for the data in the table below. x 012578 y 1 3 5 6 10 9 a. Draw a scatter diagram for the data. Should the value of r be positive or negative? Explain. b. Calculate the value of r. Round your answer to 3 decimal places. r =arrow_forwardThe following set of data represents the number of orders filled by a national-chain restaurant during a two week period. Construct a five number summary for the the data. 66, 75, 68, 89, 86, 73, 67, 75, 75, 82, 85, 74, 67, 61 (Round to the nearest hundredth, if needed). Min _________________ Lower Quartile _________________ Median __________________ Upper Quartile _________________ Maximum __________________ What is the range and the interquartile range (IQR)? Range __________________ Interquartile Range (IQR) ___________________arrow_forwardWhich of these can help you visualize data? Select all that apply. O bank statement O circle graph O spreadsheet O table O bar grapharrow_forward
- The scores and the percents of the final grade for a student in a stats class are given. What is the student's mean score? Complete the thirds columnarrow_forwardneed help with this please!arrow_forwardfind the mean, median, and range of the set of numbers. Then, use Excel to create a frequency table and a histogram of the test scores. Make sure to label your tables and graphs appropriately A researcher is studying reaction times in mice. The reaction times in milliseconds (ms) for thirty mice are shown below. 66 384 539 578 166 741 874 384 221 178 176 675 275 15 845 397 271 655 681 702 63 823 364 194 755 744 557 776 69 857arrow_forward
- Classify the histogram as skewed to the left, skewed to the right, or approximately symmetric.arrow_forwardR A veterinarian recorded how many kittens were born in each litter. This data is summarized in the L histogram below. (Note: The last class actually represents "7 or more kittens," not just 7 kittens.) 14 12 10- 8- 6- 4 1 2 3 4 7 8 # of kittens What is the frequency of litters having at most 3 kittens? ans = Fe Ro 1 FEB 18 P. W MacBook Air 20 000 esc F5 F6 F2 F3 F4 F1 & ! @ 1 2 4 5 Q W R %24 # 3 6 2. Frequencyarrow_forwardA histogram titled "20 Busiest North American Airports" has a horizontal axis labeled "Total Passengers (Millions)" and a vertical axis labeled "Frequency" with values from 0 to 10. The histogram has 8 bars. Each bar is associated with a label and an approximate value as listed below. Frequency 10 O 0 7 02 8 3 30-39.9 20 Busiest North American Airports 40-49.9 50-59.9 Total Passengers (Millions) What is the lowest frequency value? 60-69.9 70-79.9 80-89.9 90-99.9 100-109.9arrow_forward
arrow_back_ios
SEE MORE QUESTIONS
arrow_forward_ios
Recommended textbooks for you
- MATLAB: An Introduction with ApplicationsStatisticsISBN:9781119256830Author:Amos GilatPublisher:John Wiley & Sons Inc
 Probability and Statistics for Engineering and th...StatisticsISBN:9781305251809Author:Jay L. DevorePublisher:Cengage Learning
 Statistics for The Behavioral Sciences (MindTap C...StatisticsISBN:9781305504912Author:Frederick J Gravetter, Larry B. WallnauPublisher:Cengage Learning
  Elementary Statistics: Picturing the World (7th E...StatisticsISBN:9780134683416Author:Ron Larson, Betsy FarberPublisher:PEARSON
 The Basic Practice of StatisticsStatisticsISBN:9781319042578Author:David S. Moore, William I. Notz, Michael A. FlignerPublisher:W. H. Freeman
 Introduction to the Practice of StatisticsStatisticsISBN:9781319013387Author:David S. Moore, George P. McCabe, Bruce A. CraigPublisher:W. H. Freeman
MATLAB: An Introduction with Applications
Statistics
ISBN:9781119256830
Author:Amos Gilat
Publisher:John Wiley & Sons Inc
Probability and Statistics for Engineering and th...
Statistics
ISBN:9781305251809
Author:Jay L. Devore
Publisher:Cengage Learning
Statistics for The Behavioral Sciences (MindTap C...
Statistics
ISBN:9781305504912
Author:Frederick J Gravetter, Larry B. Wallnau
Publisher:Cengage Learning
Elementary Statistics: Picturing the World (7th E...
Statistics
ISBN:9780134683416
Author:Ron Larson, Betsy Farber
Publisher:PEARSON
The Basic Practice of Statistics
Statistics
ISBN:9781319042578
Author:David S. Moore, William I. Notz, Michael A. Fligner
Publisher:W. H. Freeman
Introduction to the Practice of Statistics
Statistics
ISBN:9781319013387
Author:David S. Moore, George P. McCabe, Bruce A. Craig
Publisher:W. H. Freeman