
MATLAB: An Introduction with Applications
6th Edition
ISBN: 9781119256830
Author: Amos Gilat
Publisher: John Wiley & Sons Inc
expand_more
expand_more
format_list_bulleted
Related questions
Question

Transcribed Image Text:E
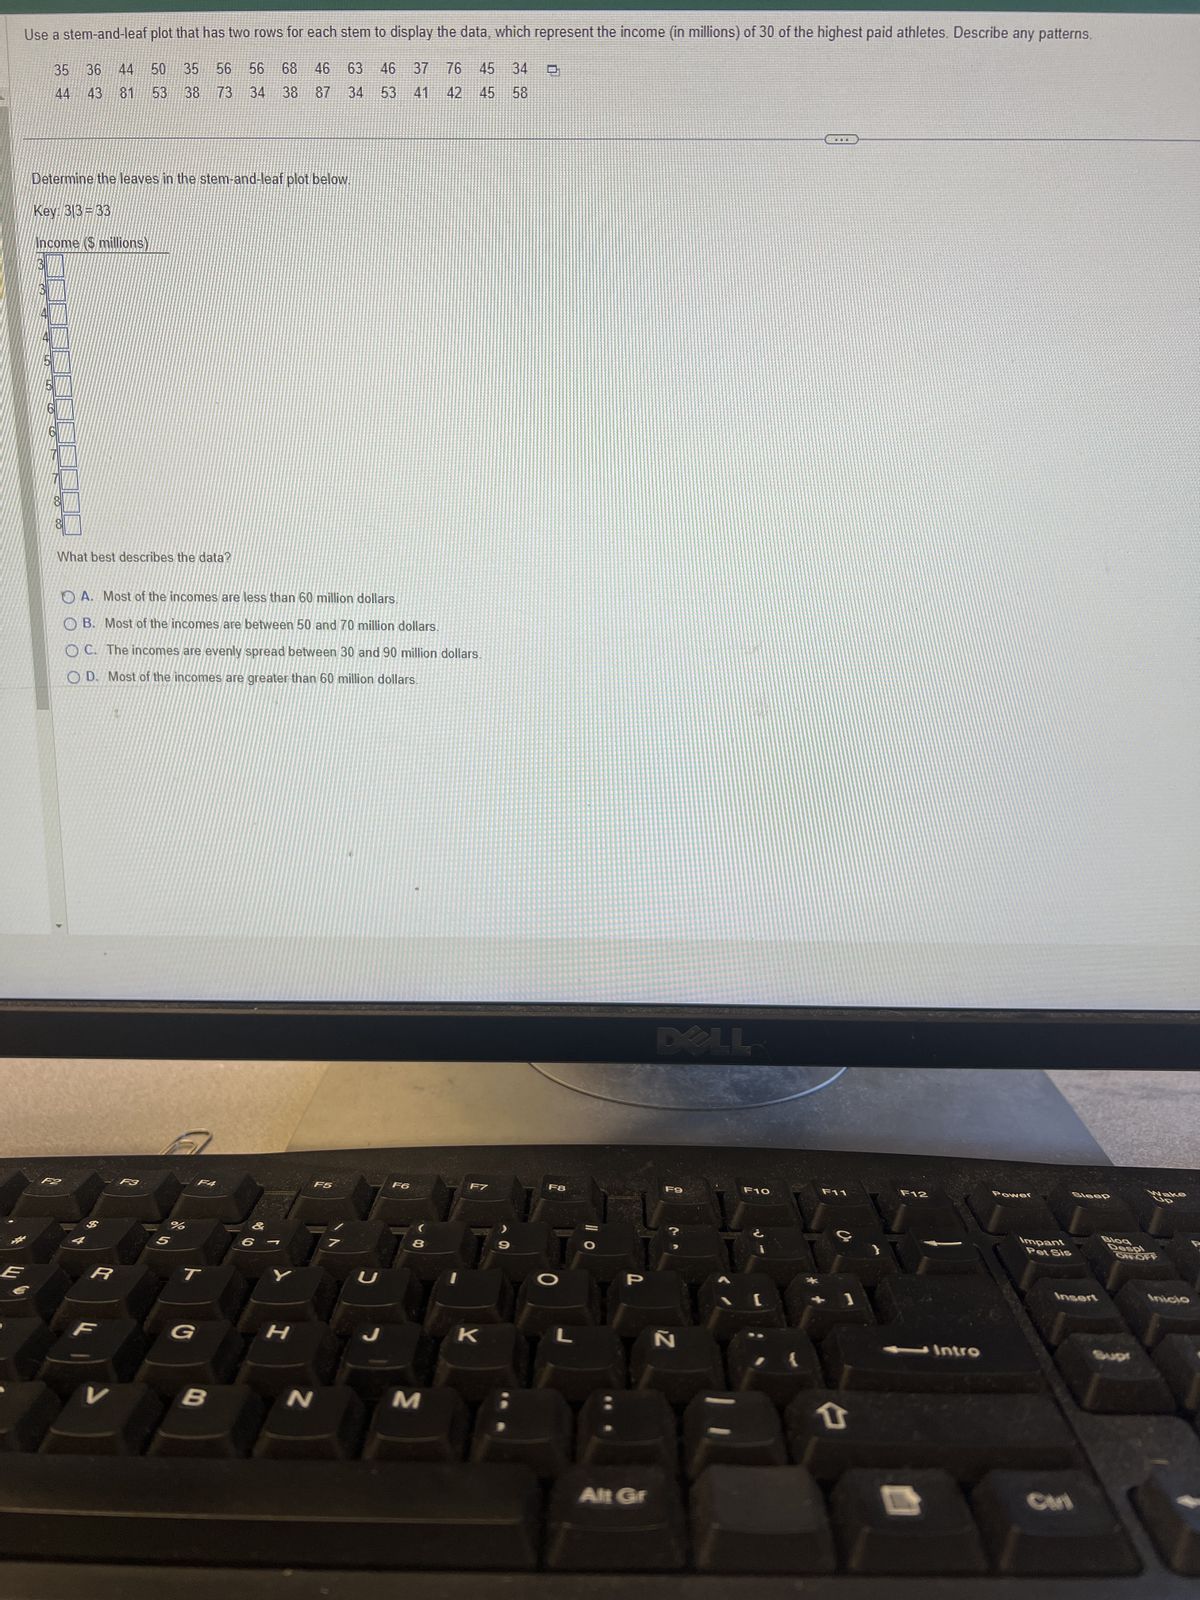
Use a stem-and-leaf plot that has two rows for each stem to display the data, which represent the income (in millions) of 30 of the highest paid athletes. Describe any patterns.
76 45 34
35 36 44 50 35 56 56
44 43 81 53 38 73
68 46 63
38 87 34
34
42 45 58
Determine the leaves in the stem-and-leaf plot below.
Key: 313-33
Income ($ millions)
3
What best describes the data?
站
F2
R
OA. Most of the incomes are less than 60 million dollars.
OB. Most of the incomes are between 50 and 70 million dollars.
OC. The incomes are evenly spread between 30 and 90 million dollars.
OD. Most of the incomes are greater than 60 million dollars.
V
%
5
F4
T
G
B
Y
H
N
F5
46
53
U
J
37
41
F6
(
8
M
K
9
F8
L
P
Alt Gr
DELL
F9
N
F10
TE
F11
1
T
F12
- Intro
Power
Impant
Sleep
Pet Sis
Insert
Blog
Despl
Wake
ONLOFF
Supr
Inicio
Expert Solution
This question has been solved!
Explore an expertly crafted, step-by-step solution for a thorough understanding of key concepts.

This is a popular solution

Trending nowThis is a popular solution!

Step by stepSolved in 3 steps with 2 images

Knowledge Booster

Similar questions
- Assistance please, using the information from the image given below: 1. Compare the variation in the annual income for the UWI Open Campus and the annual income of New York University Explain why you chose this method to compare the variations.arrow_forwardThe data represents the heights of eruptions by a geyser. Use the heights to construct a stemplot. Identify the two values that are closest to the middle when the data are sorted in order from lowest to highest. Height of eruption (in.) 61 37 50 90 80 50 40 70 50 68 75 59 58 66 68 60 73 70 47 88 Identify the two values that are closest to the middle when the data are sorted in order from lowest to highest. The values closest to the middle are enter your response here inches and enter your response here inches. (Type whole numbers. Use ascending order.)arrow_forwardStudent grades on a chemistry exam were: 77, 78, 76, 81, 86, 51, 79, 82, 84, 99Construct a stem-and-leaf plot of the data.arrow_forward
- Here are the scores of 16 students on a history test. 61, 63, 70, 72, 75, 75, 76, 79, 79, 81, 82, 84, 84, 89, 91, 95. Notice that the scores are ordered from least to greatest. Make a box-and-whisker plot for the data. +++ 60 65 70 75 85 90 95 Score 80arrow_forwardTwenty members of a health club who jog were asked how many miles they jog per week. The responses are to the right. Construct a stem-and-leaf display. For single digit data, use a stem of 0. Complete the stem-and-leaf display. (Use ascending order.) ... 13 125 19 15 17 2 22 31 129 41 23 34 18 19 24 19 12 14 18 15arrow_forwardThe final letter grades earned on a mathematies course are given in the table below. A B C D F W 12 20 10 4 Use a pie chart to represent this data. Write down the work leading to your answer. The last page has a protractor which you may print and use.arrow_forward
- Student grades on a chemistry exam were: 79, 78, 76, 82, 86, 50, 79, 81, 83, 99 Construct a stem-and-leaf plot of the data. (Use the tens digit as the stem and the ones digit as the leaf. Enter your answers from smallest to largest, separated by spaces. Enter NONE for stems with no leaves.) 5 6 7 8 9arrow_forwardThe ages (in years) and helghts (in inches) of all pitchers for a beseball team are listed. Find the coefficient of variation for each of the two data sets. Then compare the results. -Click the Icon to view the data sets. CV. %D Round to one decimal place as needed.)arrow_forwardUse a scatter plot to display the data shown in the table below. The data represents the number of students per teacher and the average teacher salaries (in thousands of dollars) in 10 school districts. Number of Students per Teacher Average Teacher's Salary 17.2 28.6 17.8 46.6 18.2 32.1 17.4 27.6 18.4 39.8 17.6 32.8 15.0 49.5 17.5 38.4 13.7 42.1 18.0 32.4 1.Construct a scatter diagram. 2.Describe the relation between students per teacher and average teacher salary. A. As the amount of students per teacher increases, the average teacher salary also increases. B. As the amount of students per teacher decreases, the average teacher salary increases. C. There appears to be no relation between students per teacher and average teacher salary.arrow_forward
- P 5 6 7 8 9 10 11 12 13 14 15 16 17 18 19 data Q Based on the boxplot above, identify the 5 number summaryarrow_forwardUse the box-and-whisker plot to identify the five-number summary. 940 2081 1205 1477 1957 900 1200 1500 1800 2100arrow_forwardStudent grades on a chemistry exam were: 79, 77, 76, 82, 86, 50, 79, 81, 83, 99 Part (a) Construct a stem-and-leaf plot of the data. (Use the tens digit as the stem and the ones digit as the leaf. Enter your answers from smallest to largest, separated by spaces. Enter NONE for stems with no leaves.) 5 6 7 8 9 Are there any potential outliers? If so, which scores are they? Why do you consider them outliers? 1.There are no outliers in the data set because there are no large gaps in the stem-and-leaf plot. 2. The two outliers are 50 (because it lies 1.5 × IQR below the first quartile) and 99 (because it lies 1.5 × IQR above the upper quartile). 3.The only outlier is 99 because it is the largest value in the data set. 4.The only outlier is 50 because it lies 1.5 × IQR below the first quartile.arrow_forward
arrow_back_ios
SEE MORE QUESTIONS
arrow_forward_ios
Recommended textbooks for you
- MATLAB: An Introduction with ApplicationsStatisticsISBN:9781119256830Author:Amos GilatPublisher:John Wiley & Sons Inc
 Probability and Statistics for Engineering and th...StatisticsISBN:9781305251809Author:Jay L. DevorePublisher:Cengage Learning
 Statistics for The Behavioral Sciences (MindTap C...StatisticsISBN:9781305504912Author:Frederick J Gravetter, Larry B. WallnauPublisher:Cengage Learning
  Elementary Statistics: Picturing the World (7th E...StatisticsISBN:9780134683416Author:Ron Larson, Betsy FarberPublisher:PEARSON
 The Basic Practice of StatisticsStatisticsISBN:9781319042578Author:David S. Moore, William I. Notz, Michael A. FlignerPublisher:W. H. Freeman
 Introduction to the Practice of StatisticsStatisticsISBN:9781319013387Author:David S. Moore, George P. McCabe, Bruce A. CraigPublisher:W. H. Freeman
MATLAB: An Introduction with Applications
Statistics
ISBN:9781119256830
Author:Amos Gilat
Publisher:John Wiley & Sons Inc
Probability and Statistics for Engineering and th...
Statistics
ISBN:9781305251809
Author:Jay L. Devore
Publisher:Cengage Learning
Statistics for The Behavioral Sciences (MindTap C...
Statistics
ISBN:9781305504912
Author:Frederick J Gravetter, Larry B. Wallnau
Publisher:Cengage Learning
Elementary Statistics: Picturing the World (7th E...
Statistics
ISBN:9780134683416
Author:Ron Larson, Betsy Farber
Publisher:PEARSON
The Basic Practice of Statistics
Statistics
ISBN:9781319042578
Author:David S. Moore, William I. Notz, Michael A. Fligner
Publisher:W. H. Freeman
Introduction to the Practice of Statistics
Statistics
ISBN:9781319013387
Author:David S. Moore, George P. McCabe, Bruce A. Craig
Publisher:W. H. Freeman