Use regression to find a quadratic model for the given data. (Round the terms to four decimal places.) 0.6 0.7 2.6 4.7 5.3 -5.6 6.7 21.1 16.9 2.5
Use regression to find a quadratic model for the given data. (Round the terms to four decimal places.) 0.6 0.7 2.6 4.7 5.3 -5.6 6.7 21.1 16.9 2.5

Functions and Change: A Modeling Approach to College Algebra (MindTap Course List)
6th Edition
ISBN:9781337111348
Author:Bruce Crauder, Benny Evans, Alan Noell
Publisher:Bruce Crauder, Benny Evans, Alan Noell
Chapter5: A Survey Of Other Common Functions
Section5.5: Quadratic Functions
Problem 17SBE

Related questions
Question
100%
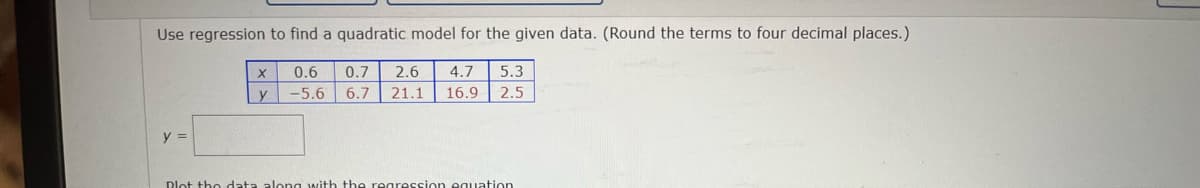
Transcribed Image Text:Use regression to find a quadratic model for the given data. (Round the terms to four decimal places.)
0.6
0.7
2.6
4.7
5.3
y
-5.6 6.7
21.1
16.9
2.5
y =
Dlot the data along with the regression eauation
Expert Solution
This question has been solved!
Explore an expertly crafted, step-by-step solution for a thorough understanding of key concepts.

This is a popular solution!

Trending now
This is a popular solution!

Step by step
Solved in 2 steps with 2 images

Recommended textbooks for you
Functions and Change: A Modeling Approach to Coll…
Algebra
ISBN:
9781337111348
Author:
Bruce Crauder, Benny Evans, Alan Noell
Publisher:
Cengage Learning

Glencoe Algebra 1, Student Edition, 9780079039897…
Algebra
ISBN:
9780079039897
Author:
Carter
Publisher:
McGraw Hill

Functions and Change: A Modeling Approach to Coll…
Algebra
ISBN:
9781337111348
Author:
Bruce Crauder, Benny Evans, Alan Noell
Publisher:
Cengage Learning
Glencoe Algebra 1, Student Edition, 9780079039897…
Algebra
ISBN:
9780079039897
Author:
Carter
Publisher:
McGraw Hill

Algebra & Trigonometry with Analytic Geometry
Algebra
ISBN:
9781133382119
Author:
Swokowski
Publisher:
Cengage


College Algebra (MindTap Course List)
Algebra
ISBN:
9781305652231
Author:
R. David Gustafson, Jeff Hughes
Publisher:
Cengage Learning