
Human Anatomy & Physiology (11th Edition)
11th Edition
ISBN: 9780134580999
Author: Elaine N. Marieb, Katja N. Hoehn
Publisher: PEARSON
expand_more
expand_more
format_list_bulleted
Related questions
Concept explainers
Question
Use the data to create a graph in Excel. It should be a scatter plot with a line connecting each point. Looking at the graph:
a/ Which wavelengths absorbed most by spinach and likely used for photosynthesis?
b/ Which wavelengths are absorbed least?
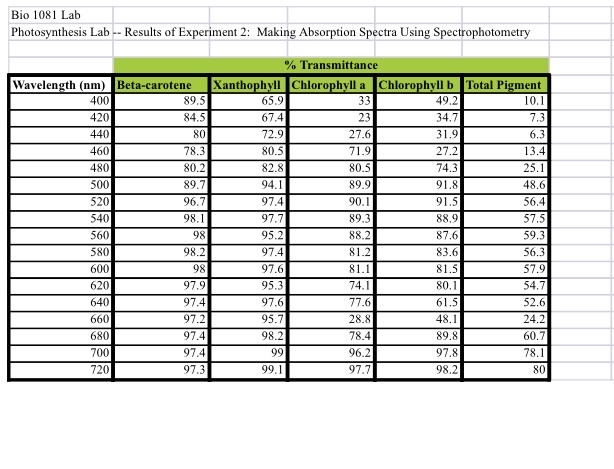

Transcribed Image Text:**Bio 1081 Lab**
**Photosynthesis Lab – Results of Experiment 2: Making Absorption Spectra Using Spectrophotometry**
### % Transmittance
| Wavelength (nm) | Beta-carotene | Xanthophyll | Chlorophyll a | Chlorophyll b | Total Pigment |
|-----------------|---------------|-------------|---------------|---------------|---------------|
| 400 | 89.5 | 65.9 | 33 | 49.2 | 10.1 |
| 420 | 84.5 | 67.4 | 23 | 34.7 | 7.7 |
| 440 | 80 | 72.9 | 27.6 | 31.9 | 6.3 |
| 460 | 78.3 | 80.5 | 39.3 | 34.7 | 7.9 |
| 480 | 80 | 82.8 | 80.5 | 74.3 | 25.1 |
| 500 | 92.7 | 86.8 | 90.3 | 91.6 | 39.4 |
| 520 | 96.7 | 97.4 | 90.1 | 91.8 | 56.4 |
| 540 | 98.7 | 97.1 | 88.9 | 90.5 | 57.5 |
| 560 | 98.5 | 95.2 | 88.2 | 87.6 | 53.9 |
| 580 | 98.2 | 97 | 87.6 | 88.2 | 54.3 |
| 600 | 98.9 | 97.6 | 81.1 | 81.5 | 57.9 |
| 620 | 98.2 | 97.4 | 86.6 | 83.4 | 52.7 |
| 640 | 98.9 | 97.
Expert Solution
This question has been solved!
Explore an expertly crafted, step-by-step solution for a thorough understanding of key concepts.

This is a popular solution

Trending nowThis is a popular solution!

Step by stepSolved in 2 steps with 1 images

Knowledge Booster


Learn more about
Need a deep-dive on the concept behind this application? Look no further. Learn more about this topic, biology and related others by exploring similar questions and additional content below.Similar questions
- Which of the following are the inputs of the light reactions? Choose all that apply. carbon dioxide gas O NADP+ ADP+P oxygen gas АТР water O NADPH sunlightarrow_forwardChlorophyll is the dominant pigment in photosynthetic cells, and degrades earlier than carotenoids in the fall. Select one: True Falsearrow_forwardI need a clear and concise definition of photosynthesis.arrow_forward
- Construct a bar graph in excel with your mung bean results. Please include appropriate labels and titles. See attached data and inculde the graph here.arrow_forwardWhat does the results from the absorption spectrum tell you about the specific pigments in the leaf?arrow_forwardDCPIP (2,6-dichlorophenol-indophenol), a blue dye, can act as an electron acceptor and becomes colorless when reduced. A suspension of chloroplasts is prepared, and DCPIP is added to the suspension. The sample is split into two test tubes. One test tube is exposed to light and the other is wrapped in foil (dark control). What would you observe over time comparing the light exposed and the dark control test tubes? A. The sample exposed to light stays blue. The sample kept in the dark turns colorless. B. The sample exposed to light turns colorless. The sample wrapped in foil stays blue. C. Both samples stay blue. D. Both samples turn colorless.arrow_forward
- In hot, dry climates, plants have evolved mechanisms to avoid photorespiration. Which of the following is FALSE Select an answer and submit. For keyboard navigation, use the up/down arrow keys to select an answer. a b с d C3 plants have no mechanism to avoid photorespiration C4 plants reduce photorespiration by separating the light reaction in the mesophyll cells from the light- independent reaction in the bundle-sheath cells CAM plants minimize photorespiration by collecting and storing CO2 at night and keeping their stomata closed during the day C4 plants include corn, sugarcane, and many grasses CAM plants can undergo photophosphorylation in the absence of sunlight 7 Open in Readinarrow_forward(please type answer not write by hend)arrow_forwardThe lab instructor will have a photosynthesis demonstration set up for your observation. What product are we observing?arrow_forward
arrow_back_ios
SEE MORE QUESTIONS
arrow_forward_ios
Recommended textbooks for you
- Human Anatomy & Physiology (11th Edition)BiologyISBN:9780134580999Author:Elaine N. Marieb, Katja N. HoehnPublisher:PEARSON
 Biology 2eBiologyISBN:9781947172517Author:Matthew Douglas, Jung Choi, Mary Ann ClarkPublisher:OpenStax
 Anatomy & PhysiologyBiologyISBN:9781259398629Author:McKinley, Michael P., O'loughlin, Valerie Dean, Bidle, Theresa StouterPublisher:Mcgraw Hill Education,
  Molecular Biology of the Cell (Sixth Edition)BiologyISBN:9780815344322Author:Bruce Alberts, Alexander D. Johnson, Julian Lewis, David Morgan, Martin Raff, Keith Roberts, Peter WalterPublisher:W. W. Norton & Company
 Laboratory Manual For Human Anatomy & PhysiologyBiologyISBN:9781260159363Author:Martin, Terry R., Prentice-craver, CynthiaPublisher:McGraw-Hill Publishing Co.
 Inquiry Into Life (16th Edition)BiologyISBN:9781260231700Author:Sylvia S. Mader, Michael WindelspechtPublisher:McGraw Hill Education
Human Anatomy & Physiology (11th Edition)
Biology
ISBN:9780134580999
Author:Elaine N. Marieb, Katja N. Hoehn
Publisher:PEARSON
Biology 2e
Biology
ISBN:9781947172517
Author:Matthew Douglas, Jung Choi, Mary Ann Clark
Publisher:OpenStax
Anatomy & Physiology
Biology
ISBN:9781259398629
Author:McKinley, Michael P., O'loughlin, Valerie Dean, Bidle, Theresa Stouter
Publisher:Mcgraw Hill Education,
Molecular Biology of the Cell (Sixth Edition)
Biology
ISBN:9780815344322
Author:Bruce Alberts, Alexander D. Johnson, Julian Lewis, David Morgan, Martin Raff, Keith Roberts, Peter Walter
Publisher:W. W. Norton & Company
Laboratory Manual For Human Anatomy & Physiology
Biology
ISBN:9781260159363
Author:Martin, Terry R., Prentice-craver, Cynthia
Publisher:McGraw-Hill Publishing Co.
Inquiry Into Life (16th Edition)
Biology
ISBN:9781260231700
Author:Sylvia S. Mader, Michael Windelspecht
Publisher:McGraw Hill Education