
MATLAB: An Introduction with Applications
6th Edition
ISBN: 9781119256830
Author: Amos Gilat
Publisher: John Wiley & Sons Inc
expand_more
expand_more
format_list_bulleted
Related questions
Question
thumb_up100%
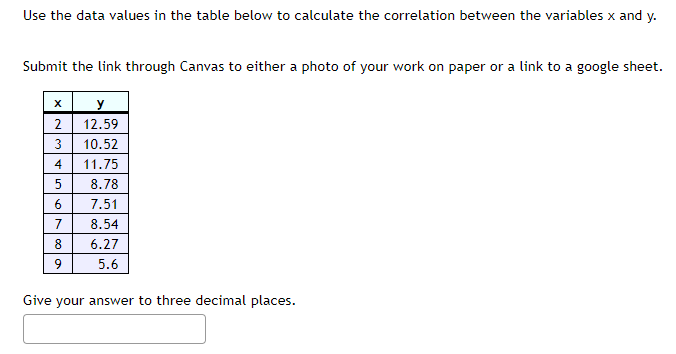

Transcribed Image Text:Use the data values in the table below to calculate the correlation between the variables x and y.
Submit the link through Canvas to either a photo of your work on paper or a link to a google sheet.
X
y
2 12.59
3
10.52
4
11.75
5
8.78
6
7.51
7
8.54
8
6.27
9
5.6
Give your answer to three decimal places.
Expert Solution
This question has been solved!
Explore an expertly crafted, step-by-step solution for a thorough understanding of key concepts.

Step by stepSolved in 2 steps with 1 images

Knowledge Booster

Similar questions
- PLEASE SHOW AN EXPLANATION FOR EACH PARTarrow_forwardCircle answerarrow_forwardUse a graphing calculator to create a scatter plot and find the line of best fit and the correlation coefficient for the following data. Round to the nearest hundredth. X 2 4 6 8124 10 Part: 0/2 y 2 3 6 7 10 15 19arrow_forward
- Use this data which give the dosage levels for a particular drug and the heart rate measured 30 minutes after taking the drug. Dose (mg) Heart rate 0.125 95 0.20 90 0.25 93 0.30 92 0.35 88 0.40 80 0.50 82 Create a scatter plot. Use your Ti-84arrow_forwardConstruct a scatter plot from the given points and describe the correlation.arrow_forwardA pediatrician records the age x (in yr) and average height y (in inches) for girls between the ages of 2 and 10. Height of Girls vs. Age 50- 40- (4,38) 30- 10- 0 Age(yr) Part: 0 / 4 Part 1 of 4 (a) Use the points (4, 38) and (8, 50) to write a linear model for these data. X y = Skip Part Check Height (in.) (8,50) Ⓒ2022 McGraw Hill LLC. All Rights Reserve Aarrow_forward
- answer pleasearrow_forwardThe table shows total earnings, y (in dollars ), of a food x,0,1,2,3,4,5,6 y,0,18,40,62,77,85,113 a. Make a scatter plot. b. What type of correlation is shown in the graarrow_forwardThe accompanying table lists the ages of acting award winners matched by the years in which the awards were won. Construct a scatterplot, find the value of the linear correlation coefficient r, and find the P-value of r. Determine whether there is sufficient evidence to support a claim of linear correlation between the two variables. Should we expect that there would be a correlation? Use a significance level of a = 0.01. Click the icon to view the ages of the award winners. Construct a scatterplot. Choose the correct graph below. OA 70- 20- 20 70 Best Actress (years) B. 70- 20- 20 70 Best Actress (years) The linear correlation coefficient is r = (Round to three decimal places as needed.) 70- 20- 20 70 Best Actress (years) Q G D. 70- 20- 20 70 Best Actress (years)arrow_forward
arrow_back_ios
arrow_forward_ios
Recommended textbooks for you
- MATLAB: An Introduction with ApplicationsStatisticsISBN:9781119256830Author:Amos GilatPublisher:John Wiley & Sons Inc
 Probability and Statistics for Engineering and th...StatisticsISBN:9781305251809Author:Jay L. DevorePublisher:Cengage Learning
 Statistics for The Behavioral Sciences (MindTap C...StatisticsISBN:9781305504912Author:Frederick J Gravetter, Larry B. WallnauPublisher:Cengage Learning
  Elementary Statistics: Picturing the World (7th E...StatisticsISBN:9780134683416Author:Ron Larson, Betsy FarberPublisher:PEARSON
 The Basic Practice of StatisticsStatisticsISBN:9781319042578Author:David S. Moore, William I. Notz, Michael A. FlignerPublisher:W. H. Freeman
 Introduction to the Practice of StatisticsStatisticsISBN:9781319013387Author:David S. Moore, George P. McCabe, Bruce A. CraigPublisher:W. H. Freeman
MATLAB: An Introduction with Applications
Statistics
ISBN:9781119256830
Author:Amos Gilat
Publisher:John Wiley & Sons Inc
Probability and Statistics for Engineering and th...
Statistics
ISBN:9781305251809
Author:Jay L. Devore
Publisher:Cengage Learning
Statistics for The Behavioral Sciences (MindTap C...
Statistics
ISBN:9781305504912
Author:Frederick J Gravetter, Larry B. Wallnau
Publisher:Cengage Learning
Elementary Statistics: Picturing the World (7th E...
Statistics
ISBN:9780134683416
Author:Ron Larson, Betsy Farber
Publisher:PEARSON
The Basic Practice of Statistics
Statistics
ISBN:9781319042578
Author:David S. Moore, William I. Notz, Michael A. Fligner
Publisher:W. H. Freeman
Introduction to the Practice of Statistics
Statistics
ISBN:9781319013387
Author:David S. Moore, George P. McCabe, Bruce A. Craig
Publisher:W. H. Freeman