
MATLAB: An Introduction with Applications
6th Edition
ISBN: 9781119256830
Author: Amos Gilat
Publisher: John Wiley & Sons Inc
expand_more
expand_more
format_list_bulleted
Related questions
Question
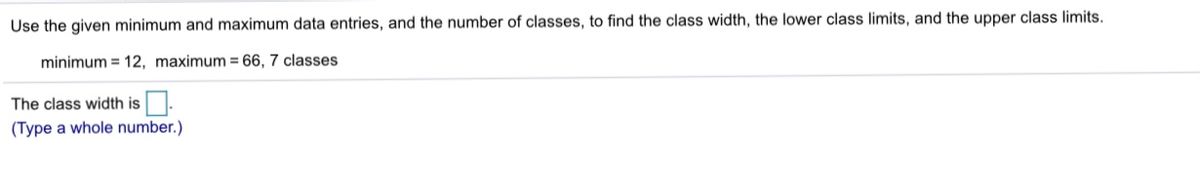

Transcribed Image Text:Use the given minimum and maximum data entries, and the number of classes, to find the class width, the lower class limits, and the upper class limits.
minimum = 12, maximum = 66, 7 classes
The class width is.
(Type a whole number.)
Expert Solution
This question has been solved!
Explore an expertly crafted, step-by-step solution for a thorough understanding of key concepts.

This is a popular solution

Trending nowThis is a popular solution!

Step by stepSolved in 2 steps

Knowledge Booster


Learn more about
Need a deep-dive on the concept behind this application? Look no further. Learn more about this topic, statistics and related others by exploring similar questions and additional content below.Similar questions
- ← Use the given minimum and maximum data entries, and the number of classes, to find the class width, the lower class limits, and the upper class limits. minimum = 8, maximum = 94, 6 classes The class width is Choose the correct lower class limits below. OA. 8, 23, 38, 53, 68, 83 OB. 23, 37, 53, 68, 83, 97 OC. 22, 37, 53, 67, 82, 97 OD. 8, 22, 38, 52, 67, 83 Choose the correct upper class limits below. OA. 22, 37, 52, 67, 82, 97 OB. 22, 37, 53, 68, 82, 97 OC. 23, 38, 53, 68, 83,97 OD. 23, 38, 52, 67, 83,97 IEEEarrow_forwardUse the given minimum and maximum data entries, and the number of classes, to find the class width, the lower class limits, and the upper class limits. minimum = 13, maximum = 78, 6 classes The class width is Choose the correct lower class limits below. OA. 13, 24, 35, 46, 57, 68 OB. 23, 34, 46, 56, 67, 78 O C. 13, 23, 35, 45, 56, 68 OD. 24, 34, 46, 57, 68, 78 Choose the correct upper class limits below. OA. 24, 35, 45, 56, 68, 78 OB. 23, 34, 45, 56, 67, 78 OC. 24, 35, 46, 57, 68, 78 OD. 23, 34, 46, 57, 67, 78arrow_forwardWhich of these can help you visualize data? Select all that apply. O bank statement O circle graph O spreadsheet O table O bar grapharrow_forward
- Use the given minimum and maximum data entries, and the number of classes, to find the class width, the lower class limits, and the upper class limits. minimum=7, maximum=74, 7 classesarrow_forwardUse the maximum and minimum data entries and the number of classes to find the class width, the lower class limits, and the upper class limits. min = 1, max = 30, 6 classesarrow_forwardPlease no written by hand solution and no imagearrow_forward
- tatcrunch 2 Refer to the accompanying data display that results from a sample of airport data speeds in Mbps. Complete parts (a) through (c) below. Click the icon to view at distribution table. W S X H d a. What is the number of degrees of freedom that should be used for finding the critical value t/2? df = 0 (Type a whole number.) b. Find the critical value t/2 corresponding to a 95% confidence level. ¹ x/2 = (Round to two decimal places as needed.) c. Give a brief general description of the number of degrees of freedom. Tech help # 3 OA. The number of degrees of freedom for a collection of sample data is the total number of sample values. OB. The number of degrees of freedom for a collection of sample data is the number of sample values that can vary after certain restrictions have been imposed on all data values. 20 E D с F3 $ 4 888 R F V % 5 T G F5 B MacBook Air Y H 8 7 N F7 TEE U J 00* 8 ►II M F8 9 K O L command F10 P { alt option (13.046,22.15) x=17.598 Sx=16.01712719 n=50 1 Next…arrow_forward−13,−13,−13,0,0,0,11−13,−13,−13,0,0,0,11 Determine if the data set is unimodal, bimodal, multimodal, or has no mode. Identify the mode(s), if any exist.arrow_forwardDetermine whether the statement is true or false. If it is false, rewrite it as a true statement. The midpoint of a class is the sum of its lower and upper limits divided by two. Choose the correct answer below. OA. The statement is false. A true statement is "The midpoint of a class is the class frequency divided by the sample size." B. The statement is false. A true statement is "The midpoint of a class is the average of its lower and upper limits." OC. The statement is false. A true statement is "The midpoint of a class is the difference of its lower and upper limits divided by two." O D. The statement is true.arrow_forward
- Use the given minimum and maximum data entries, and the number of classes, to find the class width, the lower class limits, and the upper class limits. minimum=16, maximum=121, 8 classes Question content area bottom Part 1 The class width is enter your response here . (Type a whole number.) Part 2 Choose the correct lower class limits below. A. 16, 29, 44, 57, 71, 86, 99, 114 B. 30, 43, 58, 72, 86, 99, 113, 127 C. 16, 30, 44, 58, 72, 86, 100, 114 D. 29, 43, 58, 71, 85, 99, 114, 127 Part 3 Choose the correct upper class limits below. A. 30, 44, 58, 72, 86, 99, 114, 127 B. 29, 43, 57, 71, 85, 99, 113, 127 C. 29, 43, 58, 72, 85, 99, 113, 127 D. 30, 44, 57, 71, 86, 99, 114, 127arrow_forwardUse the given minimum and maximum data entries, and the number of classes, to find the class width, the lower class limits, and the upper class limits. minimum 10, maximum = 86, 6 classes The class width is Choose the correct lower class limits below. OA. 22, 35, 49, 61, 74, 87 OB. 23, 35, 49, 62, 75, 87 O c. 10, 22, 36, 48, 61, 75 OD. 10, 23, 36, 49, 62, 75 Choose the correct upper class limits below. OA. 22, 35, 48, 61, 74, 87 OB. 22, 35, 49, 62, 74, 87 OC. 23, 36, 48, 61, 75, 87 OD. 23, 36, 49, 62, 75, 87arrow_forwardUse the given minimum and maximum data entries, and the number of classes, to find the class width, the lower class limits, and the upper class limits. minimumequals=10, maximumequals=67, 66 classes Question content area bottom Part 1 The class width is enter your response here. Part 2 Choose the correct lower class limits below. A. 10, 20, 30, 40, 50, 60 B. 20, 29, 40, 50, 60, 69 C. 10, 19, 30, 39, 49, 60 D. 19, 29, 40, 49, 59, 69 Part 3 Choose the correct upper class limits below. A. 20, 30, 40, 50, 60, 69 B. 20, 30, 39, 49, 60, 69 C. 19, 29, 39, 49, 59, 69 D. 19, 29, 40, 50, 59, 69 The class width is.Choose the correct lower class limits below.Choose the correct upper class limits below.arrow_forward
arrow_back_ios
SEE MORE QUESTIONS
arrow_forward_ios
Recommended textbooks for you
- MATLAB: An Introduction with ApplicationsStatisticsISBN:9781119256830Author:Amos GilatPublisher:John Wiley & Sons Inc
 Probability and Statistics for Engineering and th...StatisticsISBN:9781305251809Author:Jay L. DevorePublisher:Cengage Learning
 Statistics for The Behavioral Sciences (MindTap C...StatisticsISBN:9781305504912Author:Frederick J Gravetter, Larry B. WallnauPublisher:Cengage Learning
  Elementary Statistics: Picturing the World (7th E...StatisticsISBN:9780134683416Author:Ron Larson, Betsy FarberPublisher:PEARSON
 The Basic Practice of StatisticsStatisticsISBN:9781319042578Author:David S. Moore, William I. Notz, Michael A. FlignerPublisher:W. H. Freeman
 Introduction to the Practice of StatisticsStatisticsISBN:9781319013387Author:David S. Moore, George P. McCabe, Bruce A. CraigPublisher:W. H. Freeman
MATLAB: An Introduction with Applications
Statistics
ISBN:9781119256830
Author:Amos Gilat
Publisher:John Wiley & Sons Inc
Probability and Statistics for Engineering and th...
Statistics
ISBN:9781305251809
Author:Jay L. Devore
Publisher:Cengage Learning
Statistics for The Behavioral Sciences (MindTap C...
Statistics
ISBN:9781305504912
Author:Frederick J Gravetter, Larry B. Wallnau
Publisher:Cengage Learning
Elementary Statistics: Picturing the World (7th E...
Statistics
ISBN:9780134683416
Author:Ron Larson, Betsy Farber
Publisher:PEARSON
The Basic Practice of Statistics
Statistics
ISBN:9781319042578
Author:David S. Moore, William I. Notz, Michael A. Fligner
Publisher:W. H. Freeman
Introduction to the Practice of Statistics
Statistics
ISBN:9781319013387
Author:David S. Moore, George P. McCabe, Bruce A. Craig
Publisher:W. H. Freeman