Use the sample data and confidence level given below to complete parts (a) through (d). In a study of cell phone use and brain hemispheric dominance, an Internet survey was e-mailed to 2660 subjects randomly selected from an online group involved with ears. 1037 surveys were returned. Construct a 99% confidence interval for the proportion of returned survey: - X Standard Normal (z) Distribution Z 0.0 0.1 0.2 0.3 0.4 0.5 0.6 0.7 0.8 0.9 1.0 1.1 1.2 .00 5000 5398 5793 6179 .6554 6915 .7257 7580 .7881 .8159 .8413 .8643 .8849 0 POSITIVE z Scores Cumulative Area from the LEFT .01 .02 5040 .5080 5438 5478 .5832 .5871 .6217 .6255 .6591 .6628 .6950 .6985 .7291 .7324 .7611 .7642 .7910 .7939 .8186 .8212 .8461 8686 8888 .8438 .8665 .8869 .03 .5120 .5517 5910 6293 .6664 .7019 .7357 .7673 .7967 8238 8485 8708 8907 04 5160 5557 5948 .6331 .6700 .7054 .7389 .7704 .7995 .8264 .8508 .8729 8925 .05 5199 5596 5987 .6368 .6736 .7088 .7422 .7734 .8023 .8289 .8531 .8749 .8944 .06 5239 5636 .6026 .6406 .6772 .7123 .7454 .7764 .8051 .8315 .8554 .8770 8962 .07 5279 .5675 6064 .6443 .6808 .7157 .7486 .7794 .8078 8340 .8577 .8790 .8980 .08 5319 5714 .6103 6480 6844 .7190 7517 .7823 .8106 .8365 .8599 8810 8997 .09 5359 .5753 .6141 .6517 .6879 .7224 .7549 7852 8133 .8389 .8621 .8830 .9015 Z 0.0 0.1 0.2 0.3 0.4 0.5 0.6 0.7 0.8 0.9 1.0 1.1 1.2
Use the sample data and confidence level given below to complete parts (a) through (d). In a study of cell phone use and brain hemispheric dominance, an Internet survey was e-mailed to 2660 subjects randomly selected from an online group involved with ears. 1037 surveys were returned. Construct a 99% confidence interval for the proportion of returned survey: - X Standard Normal (z) Distribution Z 0.0 0.1 0.2 0.3 0.4 0.5 0.6 0.7 0.8 0.9 1.0 1.1 1.2 .00 5000 5398 5793 6179 .6554 6915 .7257 7580 .7881 .8159 .8413 .8643 .8849 0 POSITIVE z Scores Cumulative Area from the LEFT .01 .02 5040 .5080 5438 5478 .5832 .5871 .6217 .6255 .6591 .6628 .6950 .6985 .7291 .7324 .7611 .7642 .7910 .7939 .8186 .8212 .8461 8686 8888 .8438 .8665 .8869 .03 .5120 .5517 5910 6293 .6664 .7019 .7357 .7673 .7967 8238 8485 8708 8907 04 5160 5557 5948 .6331 .6700 .7054 .7389 .7704 .7995 .8264 .8508 .8729 8925 .05 5199 5596 5987 .6368 .6736 .7088 .7422 .7734 .8023 .8289 .8531 .8749 .8944 .06 5239 5636 .6026 .6406 .6772 .7123 .7454 .7764 .8051 .8315 .8554 .8770 8962 .07 5279 .5675 6064 .6443 .6808 .7157 .7486 .7794 .8078 8340 .8577 .8790 .8980 .08 5319 5714 .6103 6480 6844 .7190 7517 .7823 .8106 .8365 .8599 8810 8997 .09 5359 .5753 .6141 .6517 .6879 .7224 .7549 7852 8133 .8389 .8621 .8830 .9015 Z 0.0 0.1 0.2 0.3 0.4 0.5 0.6 0.7 0.8 0.9 1.0 1.1 1.2

MATLAB: An Introduction with Applications
6th Edition
ISBN:9781119256830
Author:Amos Gilat
Publisher:Amos Gilat
Chapter1: Starting With Matlab
Section: Chapter Questions
Problem 1P

Related questions
Question
Transcribed Image Text:Use the sample data and confidence level given below to complete parts (a) through (d).
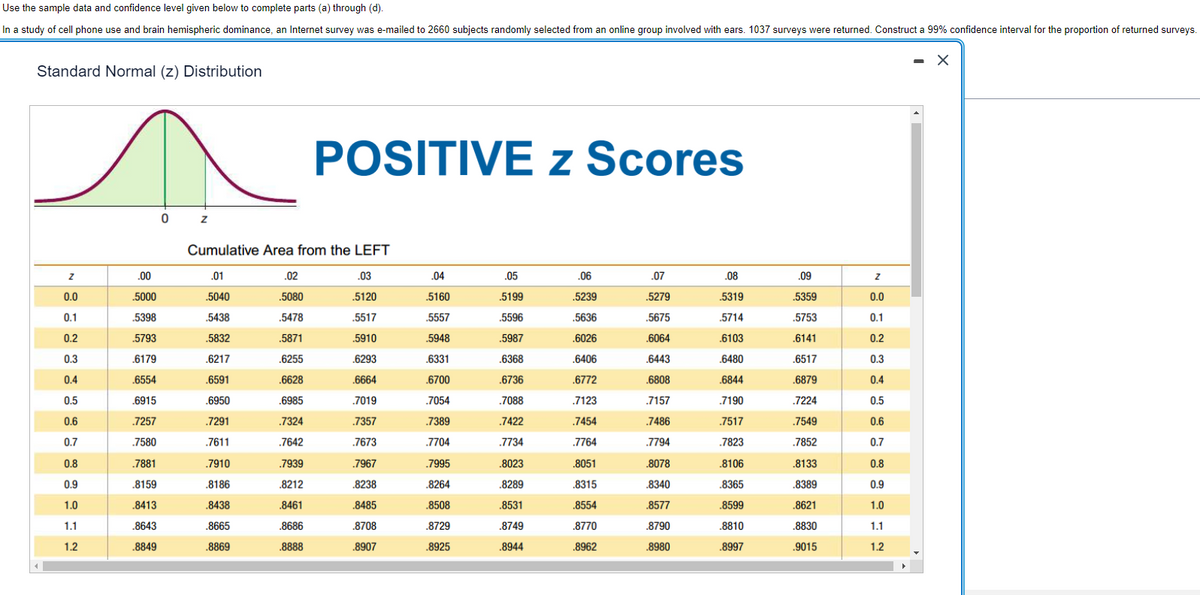
In a study of cell phone use and brain hemispheric dominance, an Internet survey was e-mailed to 2660 subjects randomly selected from an online group involved with ears. 1037 surveys were returned. Construct a 99% confidence interval for the proportion of returned surveys.
X
Standard Normal (z) Distribution
Z
0.0
0.1
0.2
0.3
0.4
0.5
0.6
0.7
0.8
0.9
1.0
1.1
1.2
.00
.5000
.5398
.5793
.6179
.6554
.6915
.7257
.7580
.7881
.8159
.8413
.8643
.8849
0
Z
Cumulative Area from the LEFT
.01
.5040
.5438
.5832
.6217
.6591
.6950
.7291
.7611
.7910
.8186
.8438
.8665
.8869
POSITIVE z Scores
.02
.5080
.5478
.5871
.6255
.6628
.6985
.7324
.7642
.7939
.8212
.8461
.8686
.8888
.03
.5120
.5517
.5910
.6293
.6664
.7019
.7357
.7673
.7967
.8238
.8485
.8708
.8907
.04
5160
.5557
.5948
.6331
.6700
.7054
.7389
.7704
.7995
.8264
.8508
.8729
.8925
.05
.5199
.5596
.5987
.6368
.6736
.7088
.7422
.7734
.8023
.8289
.8531
.8749
.8944
.06
.5239
.5636
.6026
.6406
.6772
.7123
.7454
.7764
.8051
.8315
.8554
.8770
.8962
.07
.5279
.5675
.6064
.6443
.6808
.7157
.7486
.7794
.8078
.8340
.8577
.8790
.8980
.08
5319
.5714
.6103
.6480
.6844
.7190
.7517
.7823
.8106
.8365
.8599
.8810
.8997
.09
.5359
.5753
.6141
.6517
.6879
.7224
.7549
.7852
.8133
.8389
.8621
.8830
.9015
Z
0.0
0.1
0.2
0.3
0.4
0.5
0.6
0.7
0.8
0.9
1.0
1.1
1.2
Transcribed Image Text:Click the icon to view a table of z scores.
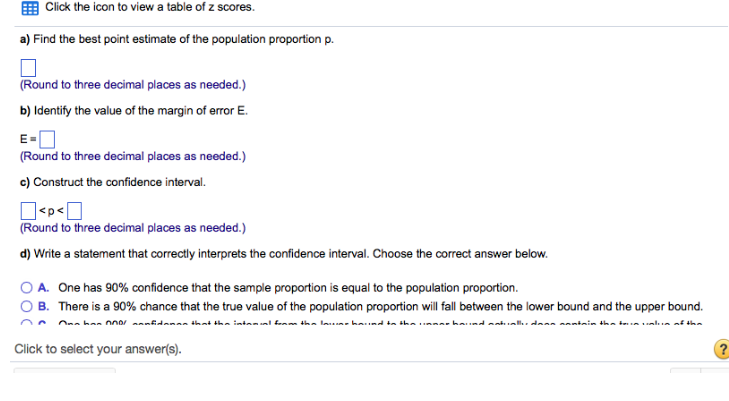
a) Find the best point estimate of the population proportion p.
(Round to three decimal places as needed.)
b) Identify the value of the margin of error E.
E=
(Round to three decimal places as needed.)
c) Construct the confidence interval.
<p<0
(Round to three decimal places as needed.)
d) Write a statement that correctly interprets the confidence interval. Choose the correct answer below.
A. One has 90% confidence that the sample proportion is equal to the population proportion.
B. There is a 90% chance that the true value of the population proportion will fall between the lower bound and the upper bound.
Ona han 0 annfidenan that the intamal form the lawine haviad to the linnao halad natually daan aantain the true value of the
Click to select your answer(s).
?
Expert Solution
This question has been solved!
Explore an expertly crafted, step-by-step solution for a thorough understanding of key concepts.

This is a popular solution!

Trending now
This is a popular solution!

Step by step
Solved in 4 steps with 6 images

Recommended textbooks for you
MATLAB: An Introduction with Applications
Statistics
ISBN:
9781119256830
Author:
Amos Gilat
Publisher:
John Wiley & Sons Inc

Probability and Statistics for Engineering and th…
Statistics
ISBN:
9781305251809
Author:
Jay L. Devore
Publisher:
Cengage Learning

Statistics for The Behavioral Sciences (MindTap C…
Statistics
ISBN:
9781305504912
Author:
Frederick J Gravetter, Larry B. Wallnau
Publisher:
Cengage Learning
MATLAB: An Introduction with Applications
Statistics
ISBN:
9781119256830
Author:
Amos Gilat
Publisher:
John Wiley & Sons Inc
Probability and Statistics for Engineering and th…
Statistics
ISBN:
9781305251809
Author:
Jay L. Devore
Publisher:
Cengage Learning
Statistics for The Behavioral Sciences (MindTap C…
Statistics
ISBN:
9781305504912
Author:
Frederick J Gravetter, Larry B. Wallnau
Publisher:
Cengage Learning

Elementary Statistics: Picturing the World (7th E…
Statistics
ISBN:
9780134683416
Author:
Ron Larson, Betsy Farber
Publisher:
PEARSON

The Basic Practice of Statistics
Statistics
ISBN:
9781319042578
Author:
David S. Moore, William I. Notz, Michael A. Fligner
Publisher:
W. H. Freeman

Introduction to the Practice of Statistics
Statistics
ISBN:
9781319013387
Author:
David S. Moore, George P. McCabe, Bruce A. Craig
Publisher:
W. H. Freeman