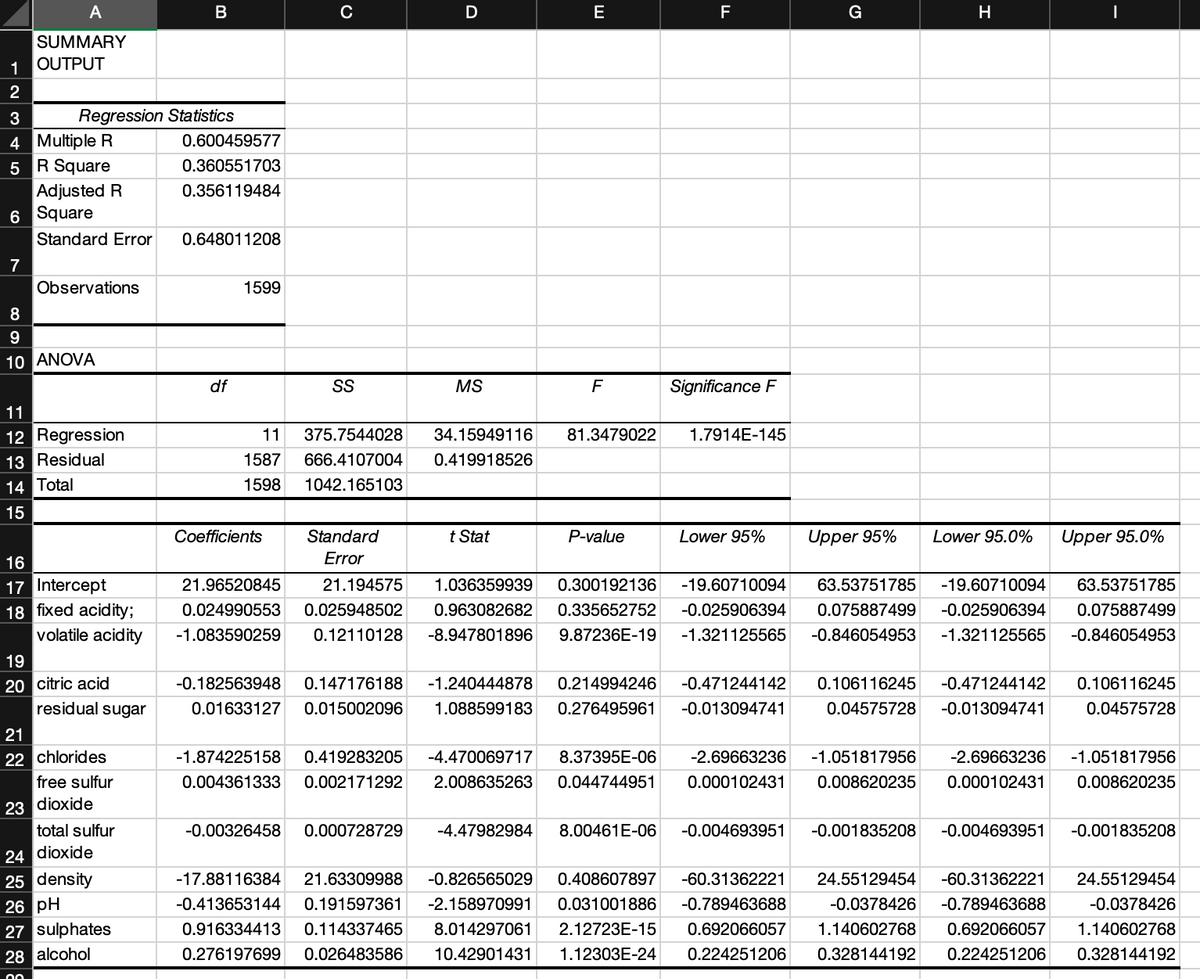
Using 1% & 5% alphas, test the overall significance of the model on excel.

MATLAB: An Introduction with Applications
6th Edition
ISBN:9781119256830
Author:Amos Gilat
Publisher:Amos Gilat
Chapter1: Starting With Matlab
Section: Chapter Questions
Problem 1P

Related questions
Question
1. Using 1% & 5% alphas, test the overall significance of the model on excel.
Transcribed Image Text:A
SUMMARY
1 OUTPUT
WN
2
3
4 Multiple R
5 R Square
Regression Statistics
7
Adjusted R
6 Square
Standard Error
Observations
8
9
10 ANOVA
11
12 Regression
13 Residual
14 Total
15
16
17 Intercept
18 fixed acidity;
volatile acidity
19
20 citric acid
residual sugar
21
22 chlorides
free sulfur
23 dioxide
total sulfur
B
24 dioxide
25 density
26 pH
27 sulphates
28 alcohol
00
0.600459577
0.360551703
0.356119484
0.648011208
df
1599
с
Coefficients
SS
D
11 375.7544028 34.15949116
1587 666.4107004 0.419918526
1598 1042.165103
Standard
Error
21.96520845 21.194575
0.024990553 0.025948502
-1.083590259 0.12110128
MS
t Stat
E
F
P-value
F
81.3479022 1.7914E-145
Significance F
-1.874225158 0.419283205 -4.470069717 8.37395E-06
0.004361333 0.002171292 2.008635263 0.044744951
Lower 95%
G
Upper 95%
H
Lower 95.0%
|
Upper 95.0%
1.036359939 0.300192136 -19.60710094 63.53751785 -19.60710094 63.53751785
0.963082682 0.335652752 -0.025906394 0.075887499 -0.025906394 0.075887499
-8.947801896 9.87236E-19 -1.321125565 -0.846054953 -1.321125565 -0.846054953
-0.182563948 0.147176188 -1.240444878 0.214994246 -0.471244142 0.106116245 -0.471244142 0.106116245
0.01633127 0.015002096 1.088599183 0.276495961 -0.013094741 0.04575728 -0.013094741 0.04575728
-2.69663236 -1.051817956 -2.69663236 -1.051817956
0.000102431 0.008620235 0.000102431 0.008620235
-0.00326458 0.000728729 -4.47982984 8.00461E-06 -0.004693951 -0.001835208 -0.004693951 -0.001835208
-17.88116384 21.63309988 -0.826565029 0.408607897 -60.31362221 24.55129454 -60.31362221 24.55129454
-0.413653144 0.191597361 -2.158970991 0.031001886 -0.789463688 -0.0378426 -0.789463688
0.916334413 0.114337465 8.014297061 2.12723E-15 0.692066057 1.140602768 0.692066057
0.276197699 0.026483586 10.42901431 1.12303E-24 0.224251206 0.328144192 0.224251206
-0.0378426
1.140602768
0.328144192
Expert Solution
This question has been solved!
Explore an expertly crafted, step-by-step solution for a thorough understanding of key concepts.

This is a popular solution!

Trending now
This is a popular solution!

Step by step
Solved in 2 steps

Recommended textbooks for you
MATLAB: An Introduction with Applications
Statistics
ISBN:
9781119256830
Author:
Amos Gilat
Publisher:
John Wiley & Sons Inc

Probability and Statistics for Engineering and th…
Statistics
ISBN:
9781305251809
Author:
Jay L. Devore
Publisher:
Cengage Learning

Statistics for The Behavioral Sciences (MindTap C…
Statistics
ISBN:
9781305504912
Author:
Frederick J Gravetter, Larry B. Wallnau
Publisher:
Cengage Learning
MATLAB: An Introduction with Applications
Statistics
ISBN:
9781119256830
Author:
Amos Gilat
Publisher:
John Wiley & Sons Inc
Probability and Statistics for Engineering and th…
Statistics
ISBN:
9781305251809
Author:
Jay L. Devore
Publisher:
Cengage Learning
Statistics for The Behavioral Sciences (MindTap C…
Statistics
ISBN:
9781305504912
Author:
Frederick J Gravetter, Larry B. Wallnau
Publisher:
Cengage Learning

Elementary Statistics: Picturing the World (7th E…
Statistics
ISBN:
9780134683416
Author:
Ron Larson, Betsy Farber
Publisher:
PEARSON

The Basic Practice of Statistics
Statistics
ISBN:
9781319042578
Author:
David S. Moore, William I. Notz, Michael A. Fligner
Publisher:
W. H. Freeman

Introduction to the Practice of Statistics
Statistics
ISBN:
9781319013387
Author:
David S. Moore, George P. McCabe, Bruce A. Craig
Publisher:
W. H. Freeman