
MATLAB: An Introduction with Applications
6th Edition
ISBN: 9781119256830
Author: Amos Gilat
Publisher: John Wiley & Sons Inc
expand_more
expand_more
format_list_bulleted
Related questions
Question
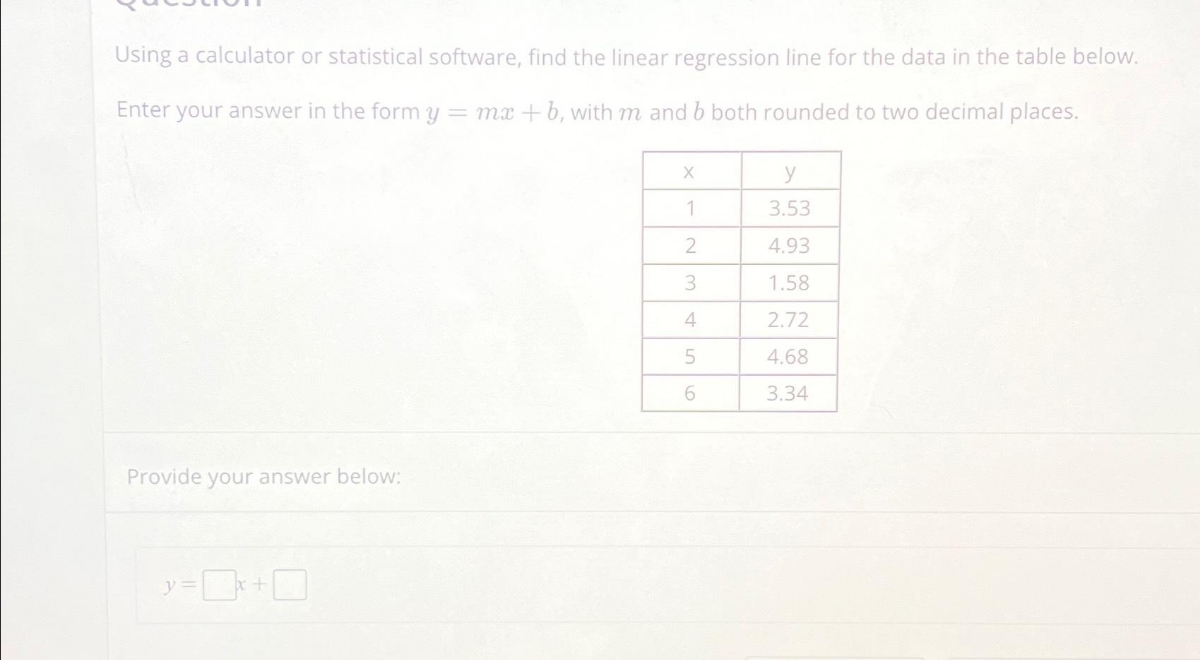

Transcribed Image Text:Using a calculator or statistical software, find the linear regression line for the data in the table below.
Enter your answer in the form y = mx + b, with m and b both rounded to two decimal places.
Provide your answer below:
X
y
1
3.53
2
4.93
3
1.58
4
2.72
5
4.68
6
3.34

Transcribed Image Text:Using a calculator or statistical software, find the linear regression line for the data in the table below. Enter your answer
in the form y = mx + b, with m and b both rounded to two decimal places. \table[[x, y
Using a calculator or statistical software, find the linear regression line for the data in the table below.
Enter your answer in the form y = mx + b, with m and b both rounded to two decimal places.
Provide your answer below:
y=0x
X
y
1
3.53
2
4.93
3
1.58
4
2.72
5
4.68
6
3.34
Expert Solution
This question has been solved!
Explore an expertly crafted, step-by-step solution for a thorough understanding of key concepts.

This is a popular solution

Trending nowThis is a popular solution!

Step by stepSolved in 2 steps

Knowledge Booster

Similar questions
- In order for applicants to work for the foreign-service department, they must take a test in the language of the country where they plan to work. The data below shows the relationship between the number of years that applicants have studied a particular language and the grades they received on the proficiency exam. Find the equation of the regression line for the given data. Number of years, x 4 4 3 6 2 7 3 Grades on test, y 61 68 75 82 73 90 58 93 72 滷 O A. =6.910x+46.261 O B. y = 46.261x+6.910 OC. v=6.910x-46.261 OD. O D. y = 46.261x -6.910 Fi St 5e Assigarrow_forwardUse the given data to find the equation of the regression line. Round the final values to three significant digits, if necessary. A horizontal table lists x-values in the first row and y-values in the second row. The x-values are as follows from left to right: 6, 8, 20, 28, and 36. The y-values are as follows from left to right: 2, 4, 13, 20, and 30. A. y with caret= −2.79 + 0.897x B. y with caret = −3.79 + 0.801x C. y with caret= −2.79 + 0.950x D. y with caret = −3.79 + 0.897xarrow_forwardRefer to the Baseball 2018 data, which reports information on the 2018 Major League Baseball season. Let attendance be the dependent variable and total team salary be the independent variable. Determine the regression equation and answer the following questions. Click here for the Excel Data Filea-1. Draw a scatter diagram.1. On the graph below, use the point tool to plot the point corresponding to the Attendance and its team salary (Salary 1).2. Repeat the process for the remainder of the sample Salary 2, Salary 3, … ).3. To enter exact coordinates, double-click on the point and enter the exact coordinates of x and y. a-2. From the diagram, does there seem to be a direct relationship between the two variables?multiple choice 1 Yes No b. What is the expected attendance for a team with a salary of $100.0 million? (Round your answer to 4 decimal places.) c. If the owners pay an additional $30 million, how many more people could they expect to attend? (Round your answer to 3…arrow_forward
- An instructor asked a random sample of eight students to record their study times at the beginning of a course. She then made a table for total hours studied (x) over 2 weeks and test score (y) at the end of the 2 weeks. The table is given below. Complete parts (a) through (f). x 10 13 10 18 6 15 16 21 y 93 79 81 74 85 81 85 80 a. Find the regression equation for the data points. b. Graph the regresson equation c. Describe the apparent relationship between the two variables. d. Identify the predictor and response variables. e. Identify outliers and potential influential observations. f.Predict the score for a student that studies for 17 hours.arrow_forwardA table of data points is given below. a. Find the regression equation for the data points. Use the formulas Sxx=∑ xi−x2 and Sxy=∑ xi−x yi−y to obtain Sxx and Sxy. b. Graph the regression equation and data points. x 1 2 3 y 6 5 10 a. The regression equation is y= + () x. (Simplify your answers. Type integers or decimals. Do not round.)arrow_forwardUse the data in the table below to complete parts (a) through (d). x 37 34 40 46 42 50 62 56 51 y 22 20 25 32 27 30 30 25 28 Find the equation of the regression line. y=arrow_forward
- The arm span and foot length were both measured (in centimeters) for each of 20 students in a biology class. The computer output displays the regression analysis. Which of the following is the best interpretation of the coefficient of determination r2? About 37% of the variation in arm span is accounted for by the linear relationship formed with the foot length. About 65% of the variation in foot length is accounted for by the linear relationship formed with the arm span. About 63% of the variation in arm span is accounted for by the linear relationship formed with the foot length. About 63% of the variation in foot length is accounted for by the linear relationship formed with the arm span.arrow_forwardThe following table gives the data for the grades on the midterm exam and the grades on the final exam. Determine the equation of the regression line, y = bo + b₁x. Round the slope and y-intercept to the nearest thousandth. Grades on Midterm and Final Exams Grades on Midterm 66 68 71 86 78 85 62 82 79 61 Grades on Final 90 63 82 96 72 83 79 91 84 65arrow_forwardPlease answer with explanation. I will really upvotearrow_forward
- Find the equation of the regression line for the given data. Then construct a scatter plot of the data and draw the regression line. (Each pair of variables has a significant correlation.) Then use the regression equation to predict the value of y for each of the given x-values, if meaningful. The caloric content and the sodium content (in milligrams) for 6 beef hot dogs are shown in the table below. 170 480 Calories, x Sodium, y 560 Find the regression equation. ŷ=x+ (Round to three decimal places as needed.) Choose the correct graph below. OA. 0ff 0 200 150 430 Calories 130 320 a 130 380 O B. 560 0 80 250 200 G Calories (a) Predict the value of y for x = 160. Choose the correct answer below. OA. 390.863 OB. 440.983 OC. 591.343 O D. not meaningful (b) Predict the value of y for x = 90. Choose the correct answer below. 190 510 (a) x (c) x 160 calories 140 calories O C. A 560+ 0-T 0 200 Calories (b) x = 90 calories (d) x = 220 calories OD. 560- 0 200 Calories Qarrow_forwardFind the equation of the regression line for the given data. Then construct a scatter plot of the data and draw the regression line. (Each pair of variables has a significant correlation.) Then use the regression equation to predict the value of y for each of the given x-values, if meaningful. The caloric content and the sodium content (in milligrams) for 6 beef hot dogs are shown in the table below. Calories, x Sodium, y 130 380 80 270 (a) x= 150 calories (c) x-120 calories 190 160 415 180 465 130 350 (b) X3D90 calories (d) x= 60 calories 540 (a) Predict the value of y for x= 150. Choose the correct answer below. O A. 212.451 B. 347.151 C. 414.501 O D. not meaningful (b) Predict the value of y for x= 90. Choose the correct answer below. O A. 212.451 O B. 347.151 es OC. 279.801arrow_forwardUse the given data to find the equation of the regression line. Round the final values to three significant digits, if necessary.arrow_forward
arrow_back_ios
arrow_forward_ios
Recommended textbooks for you
- MATLAB: An Introduction with ApplicationsStatisticsISBN:9781119256830Author:Amos GilatPublisher:John Wiley & Sons Inc
 Probability and Statistics for Engineering and th...StatisticsISBN:9781305251809Author:Jay L. DevorePublisher:Cengage Learning
 Statistics for The Behavioral Sciences (MindTap C...StatisticsISBN:9781305504912Author:Frederick J Gravetter, Larry B. WallnauPublisher:Cengage Learning
  Elementary Statistics: Picturing the World (7th E...StatisticsISBN:9780134683416Author:Ron Larson, Betsy FarberPublisher:PEARSON
 The Basic Practice of StatisticsStatisticsISBN:9781319042578Author:David S. Moore, William I. Notz, Michael A. FlignerPublisher:W. H. Freeman
 Introduction to the Practice of StatisticsStatisticsISBN:9781319013387Author:David S. Moore, George P. McCabe, Bruce A. CraigPublisher:W. H. Freeman
MATLAB: An Introduction with Applications
Statistics
ISBN:9781119256830
Author:Amos Gilat
Publisher:John Wiley & Sons Inc
Probability and Statistics for Engineering and th...
Statistics
ISBN:9781305251809
Author:Jay L. Devore
Publisher:Cengage Learning
Statistics for The Behavioral Sciences (MindTap C...
Statistics
ISBN:9781305504912
Author:Frederick J Gravetter, Larry B. Wallnau
Publisher:Cengage Learning
Elementary Statistics: Picturing the World (7th E...
Statistics
ISBN:9780134683416
Author:Ron Larson, Betsy Farber
Publisher:PEARSON
The Basic Practice of Statistics
Statistics
ISBN:9781319042578
Author:David S. Moore, William I. Notz, Michael A. Fligner
Publisher:W. H. Freeman
Introduction to the Practice of Statistics
Statistics
ISBN:9781319013387
Author:David S. Moore, George P. McCabe, Bruce A. Craig
Publisher:W. H. Freeman