
MATLAB: An Introduction with Applications
6th Edition
ISBN: 9781119256830
Author: Amos Gilat
Publisher: John Wiley & Sons Inc
expand_more
expand_more
format_list_bulleted
Related questions
Question
thumb_up100%
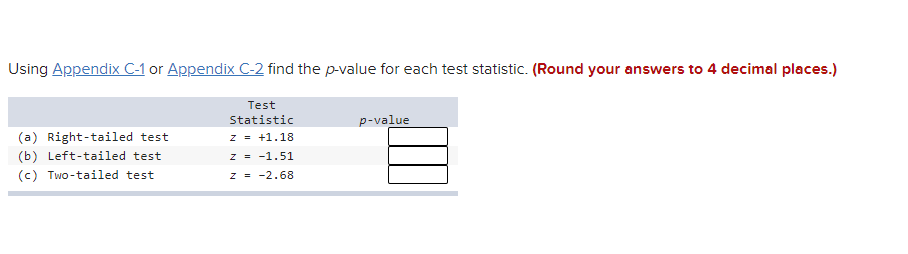

Transcribed Image Text:Using Appendix C-1 or Appendix C-2, find the p-value for each test statistic. (Round your answers to 4 decimal places.)
| | Test Statistic | p-value |
|--------------|----------------|---------|
| (a) Right-tailed test | z = +1.18 | |
| (b) Left-tailed test | z = -1.51 | |
| (c) Two-tailed test | z = -2.68 | |
Expert Solution
This question has been solved!
Explore an expertly crafted, step-by-step solution for a thorough understanding of key concepts.

This is a popular solution

Trending nowThis is a popular solution!

Step by stepSolved in 3 steps with 2 images

Knowledge Booster

Similar questions
- Explanation it correctlyarrow_forwardHow do you calculate the test statistic, t with the information below ?arrow_forwardgenuine answer, upvote guarrantee, no plagarism The Tiny Company manufactures components for word processors. Most of the work is done at the 2000-employee Tiny plant in the midwest. Your task is to estimate the mean and standard deviation of dollar-valued job performance for Assemblers (about 200 employees). You are free to make any assumptions you like about the Tiny assemblers, but be prepared to defend your assumptions. List and describe all of the factors (along with how you would measure each one) you would consider in using standard costing to estimate SDy.arrow_forward
- You are performing a left-tailed test with test statistic z = - 2.23, find the p-value to 4 decimal places Question Help: Message instructor Submit Questionarrow_forwardQuestion Help Assume that adults have IQ scores that are normally distributed with a mean of 104.3 and a standard deviation 24.4. Find the first quartile Q,, which is the IQ score separating the bottom 25% from the top 75%. (Hint: Draw a graph.) The first quartile is (Type an integer or decimal rounded to one decimal place as needed.)arrow_forwardTextbook: Statistics for the Behavioral SciencesGregory J. Privitera Summarizing Data: Central Tendency - Please show your work An instructor gives students a surprise quiz and records a mean grade of 12 points. What is the new mean value if the instructor does each of the following? Adds 10 points to each quiz Subtracts 2 points from each quiz Doubles each quiz score Divides each quiz score in halfarrow_forward
- Math SAT scores for students admitted to a university are bell-shaped with a mean of 520 and a standard deviation of 60. 99.7% of the SAT scores is between (use the word and between two numbers, for example between 200 and 800, your enter: 200 and 800 )arrow_forwardHow to find: T statistic to= P Value Null hypothesis rejected? is p value less than a 0.05 level of significancearrow_forwardQuestion Help ▼ Consider a value to be significantly low if its z score less than or equal to -2 or consider a value to be significantly high if its z score is greater than or equal to 2. A test is used to assess readiness for college. In a recent year, the mean test score was 21.7 and the standard deviation was 4.6. Identify the test scores that are significantly low or significantly high. What test scores are significantly low? Select the correct answer below and fill in the answer box(es) to complete your choice.arrow_forward
- Using this data: {4, 5, 8, 11, 16, 8}, (a) Find the 90% confidence interval for the mean. (b) Interpret what does the interval mean?arrow_forwardinvestigation hypothesises that cholesterol levels in children may be affected by educating parents on proper nutrition and exercise. The sample size is 40 families child aged 10-15 years old with high cholesterol. Children mean cholesterol is 175 stand deviation 19.5 is there significant evidenceo of a relation in total cholesterol/ null value is 191 cholestrolarrow_forwardQuestion Help Assume that adults have IQ scores that are normally distributed with a mean of 104.6 and a standard deviation 22. Find the first quartile Q,, which is the IQ score separating the bottom 25% from the top 75%. (Hint: Draw a graph.) The first quartile is . (Type an integer or decimal rounded to one decimal place as needed.)arrow_forward
arrow_back_ios
SEE MORE QUESTIONS
arrow_forward_ios
Recommended textbooks for you
- MATLAB: An Introduction with ApplicationsStatisticsISBN:9781119256830Author:Amos GilatPublisher:John Wiley & Sons Inc
 Probability and Statistics for Engineering and th...StatisticsISBN:9781305251809Author:Jay L. DevorePublisher:Cengage Learning
 Statistics for The Behavioral Sciences (MindTap C...StatisticsISBN:9781305504912Author:Frederick J Gravetter, Larry B. WallnauPublisher:Cengage Learning
  Elementary Statistics: Picturing the World (7th E...StatisticsISBN:9780134683416Author:Ron Larson, Betsy FarberPublisher:PEARSON
 The Basic Practice of StatisticsStatisticsISBN:9781319042578Author:David S. Moore, William I. Notz, Michael A. FlignerPublisher:W. H. Freeman
 Introduction to the Practice of StatisticsStatisticsISBN:9781319013387Author:David S. Moore, George P. McCabe, Bruce A. CraigPublisher:W. H. Freeman
MATLAB: An Introduction with Applications
Statistics
ISBN:9781119256830
Author:Amos Gilat
Publisher:John Wiley & Sons Inc
Probability and Statistics for Engineering and th...
Statistics
ISBN:9781305251809
Author:Jay L. Devore
Publisher:Cengage Learning
Statistics for The Behavioral Sciences (MindTap C...
Statistics
ISBN:9781305504912
Author:Frederick J Gravetter, Larry B. Wallnau
Publisher:Cengage Learning
Elementary Statistics: Picturing the World (7th E...
Statistics
ISBN:9780134683416
Author:Ron Larson, Betsy Farber
Publisher:PEARSON
The Basic Practice of Statistics
Statistics
ISBN:9781319042578
Author:David S. Moore, William I. Notz, Michael A. Fligner
Publisher:W. H. Freeman
Introduction to the Practice of Statistics
Statistics
ISBN:9781319013387
Author:David S. Moore, George P. McCabe, Bruce A. Craig
Publisher:W. H. Freeman