
MATLAB: An Introduction with Applications
6th Edition
ISBN: 9781119256830
Author: Amos Gilat
Publisher: John Wiley & Sons Inc
expand_more
expand_more
format_list_bulleted
Related questions
Question
Please provide a source code that can be copied and run into R - Programming.
The secomd image is an example of how the question's code should somewhat look.
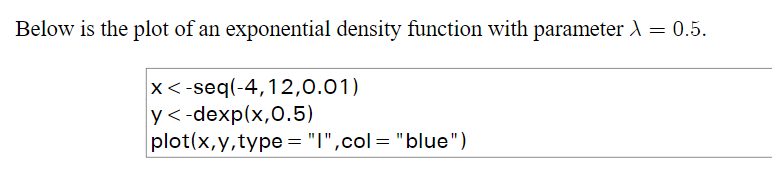

Transcribed Image Text:Below is the plot of an exponential density function with parameter \(\lambda = 0.5\).
```r
x <- seq(-4, 12, 0.01)
y <- dexp(x, 0.5)
plot(x, y, type = "l", col = "blue")
```
**Explanation:**
- The code snippet is used to generate a plot of the exponential density function.
- `seq(-4, 12, 0.01)` creates a sequence of x-values starting at -4 and ending at 12, with increments of 0.01.
- `dexp(x, 0.5)` calculates the exponential density function values for the x-values with a rate parameter (\(\lambda\)) of 0.5.
- `plot(x, y, type = "l", col = "blue")` creates a line plot of the exponential density function values (y) against the x-values, with the line colored blue.
The plot visually represents how the exponential density function behaves for the given parameter.

Transcribed Image Text:**Title:** Plotting an Exponential Density Function in R
**Objective:** Learn how to plot the exponential density function using R with a specified parameter and interval.
**Task:**
Using R, plot the exponential density function with parameter \( \lambda = 0.4 \) on the interval \( (-1, 12) \).
**Steps:**
1. **Setup R Environment:**
- Ensure you have R installed on your system.
- Open RStudio or any R console for scripting.
2. **Define the Parameters:**
- Set \( \lambda = 0.4 \) for the exponential distribution.
3. **Plotting the Function:**
- Use R’s plotting functions (such as `curve` and `dexp`) to visualize the exponential density.
- Ensure your x-values range from -1 to 12.
4. **Code Example:**
```R
# Define the lambda parameter
lambda <- 0.4
# Plot the exponential density function
curve(dexp(x, rate=lambda), from=-1, to=12, col='blue', lwd=2,
ylab='Density', xlab='x', main='Exponential Density Function')
```
5. **Explanation of the Plot:**
- The x-axis represents the range from -1 to 12.
- The y-axis corresponds to the density values.
- The exponential curve should start at zero (or close to zero for negative values) and depict a decreasing trend as x increases, showing the characteristic exponential decay.
6. **Discussion Points:**
- Explore how changing \( \lambda \) affects the shape of the curve.
- Discuss real-world applications of the exponential distribution, such as modeling time between events in a Poisson process.
By following these steps, you can effectively plot and analyze exponential density functions using the R programming language.
Expert Solution
arrow_forward
Step 1
The solution is given below:

Step by stepSolved in 2 steps with 1 images

Knowledge Booster

Similar questions
- We all use linear programming whether we realize it or not. Simple calculations such as length of time to get from point A to point B when traveling at an average of x miles per hour are linear equations. provide an example with the formula and calculated answer regarding how you use linear calculations in your day-by-day activities.arrow_forwardYou may use a map to answer this question. B = { x: x is a state that borders Illinois} Write B using the roster methodarrow_forwardPlease use R-programming. Please provide the source code that makes the program run, and then screenshot the output. Question: Suppose a parallel reliability system consists of cables of wires holding a bridge andthat one of them must have at least 90 wires. If the reliability of a single wire is 0.25 what is a minimal number of wires counted from 90 (or more) should that cable have in order to maintain the reliability of the system to at least 0.95?arrow_forward
- Digital University | UMGC X 39kYwEcmXZLpICtCej-1-6W1SZe3a0X-ViPzby?1oBw7QYjlbavbSPXtx-YCjsh_7mMmrq McGraw Hill Campus - MATH 10 x A ALEKS-TREY WATTS - Knowled; X + assess E Knowledge Check $ Tony plans to set aside money for his young daughter's college tuition. He will deposit money in an ordinary annuity that earns 5.4% interest, compounded quarterly. Deposits will be made at the end of each quarter. I Don't Know How much money does he need to deposit into the annuity each quarter for the annuity to have a total value of $71,000 after 16 years? Do not round intermediate computations, and round your final answer to the nearest cent. If necessary, refer to the list of financial formulas. Submit UNCLASSIFIED X Question 1 3 SAMSUNG © 2023 McGraw Hill LLC. All Rights Reserved. Terms of Use | Privacy Center | Accessibility TREY Espa ? 圖 FEEDarrow_forwardStudents at Upscale University are required to take at least 3 humanities and 4 science courses. The maximum allowable number of science courses is 12. Each humanities course carries 4 credits and each science course 5 credits. The total number of credits in science and humanities cannot exceed 88. Quality points for each course are assigned in the usual way: the number of credit hours times 4 for an A grade, times 3 for a B grade, and times 2 for a C grade. Susan Katz expects to get B's in all her science courses. She expects to get C's in half of her humanities courses, B's in one-fourth of them, and A's in the rest. Under these assumptions, how many courses of each kind should she take in order to earn the maximum possible number of quality points? Susan Katz should take science courses and humanities courses in order to maximize her quality points.arrow_forwardAs we beat Covid and gaming establishments in Nevada are allowed to operate at higher capacities, the autonomous spending multiplier concept explains why other businesses in Nevada will tend to benefit. Show you understand the autonomous spending multiplier concept by explaining why other businesses and their employees will tend to benefit when casinos attract more customers.arrow_forward
arrow_back_ios
arrow_forward_ios
Recommended textbooks for you
- MATLAB: An Introduction with ApplicationsStatisticsISBN:9781119256830Author:Amos GilatPublisher:John Wiley & Sons Inc
 Probability and Statistics for Engineering and th...StatisticsISBN:9781305251809Author:Jay L. DevorePublisher:Cengage Learning
 Statistics for The Behavioral Sciences (MindTap C...StatisticsISBN:9781305504912Author:Frederick J Gravetter, Larry B. WallnauPublisher:Cengage Learning
  Elementary Statistics: Picturing the World (7th E...StatisticsISBN:9780134683416Author:Ron Larson, Betsy FarberPublisher:PEARSON
 The Basic Practice of StatisticsStatisticsISBN:9781319042578Author:David S. Moore, William I. Notz, Michael A. FlignerPublisher:W. H. Freeman
 Introduction to the Practice of StatisticsStatisticsISBN:9781319013387Author:David S. Moore, George P. McCabe, Bruce A. CraigPublisher:W. H. Freeman
MATLAB: An Introduction with Applications
Statistics
ISBN:9781119256830
Author:Amos Gilat
Publisher:John Wiley & Sons Inc
Probability and Statistics for Engineering and th...
Statistics
ISBN:9781305251809
Author:Jay L. Devore
Publisher:Cengage Learning
Statistics for The Behavioral Sciences (MindTap C...
Statistics
ISBN:9781305504912
Author:Frederick J Gravetter, Larry B. Wallnau
Publisher:Cengage Learning
Elementary Statistics: Picturing the World (7th E...
Statistics
ISBN:9780134683416
Author:Ron Larson, Betsy Farber
Publisher:PEARSON
The Basic Practice of Statistics
Statistics
ISBN:9781319042578
Author:David S. Moore, William I. Notz, Michael A. Fligner
Publisher:W. H. Freeman
Introduction to the Practice of Statistics
Statistics
ISBN:9781319013387
Author:David S. Moore, George P. McCabe, Bruce A. Craig
Publisher:W. H. Freeman