Using the data below, compute for the most probable value, individual residual, probable error of any single measurement, and relative precision of the mean. RAW DATA 224 202 250 357 220 375 351 268 302 202 289 308 341 325 281 374 231 320 299 250
Using the data below, compute for the most probable value, individual residual, probable error of any single measurement, and relative precision of the mean. RAW DATA 224 202 250 357 220 375 351 268 302 202 289 308 341 325 281 374 231 320 299 250

Glencoe Algebra 1, Student Edition, 9780079039897, 0079039898, 2018
18th Edition
ISBN:9780079039897
Author:Carter
Publisher:Carter
Chapter10: Statistics
Section10.4: Distributions Of Data
Problem 19PFA

Related questions
Question
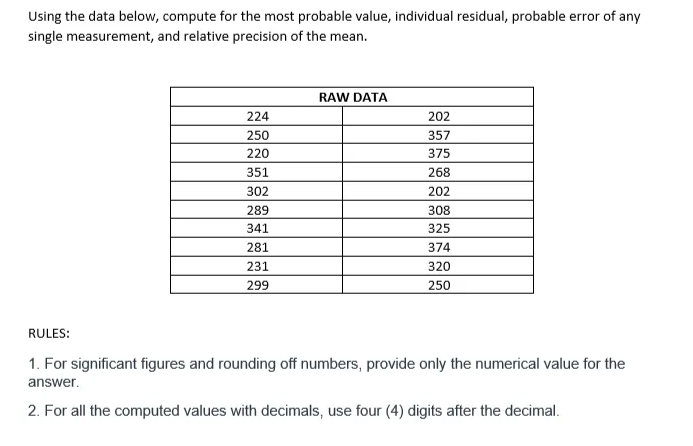
Transcribed Image Text:Using the data below, compute for the most probable value, individual residual, probable error of any
single measurement, and relative precision of the mean.
RAW DATA
224
202
250
357
220
375
351
268
302
202
289
308
341
325
281
374
231
320
299
250
RULES:
1. For significant figures and rounding off numbers, provide only the numerical value for the
answer.
2. For all the computed values with decimals, use four (4) digits after the decimal.
Expert Solution
This question has been solved!
Explore an expertly crafted, step-by-step solution for a thorough understanding of key concepts.

Step by step
Solved in 4 steps

Recommended textbooks for you
Glencoe Algebra 1, Student Edition, 9780079039897…
Algebra
ISBN:
9780079039897
Author:
Carter
Publisher:
McGraw Hill
Glencoe Algebra 1, Student Edition, 9780079039897…
Algebra
ISBN:
9780079039897
Author:
Carter
Publisher:
McGraw Hill