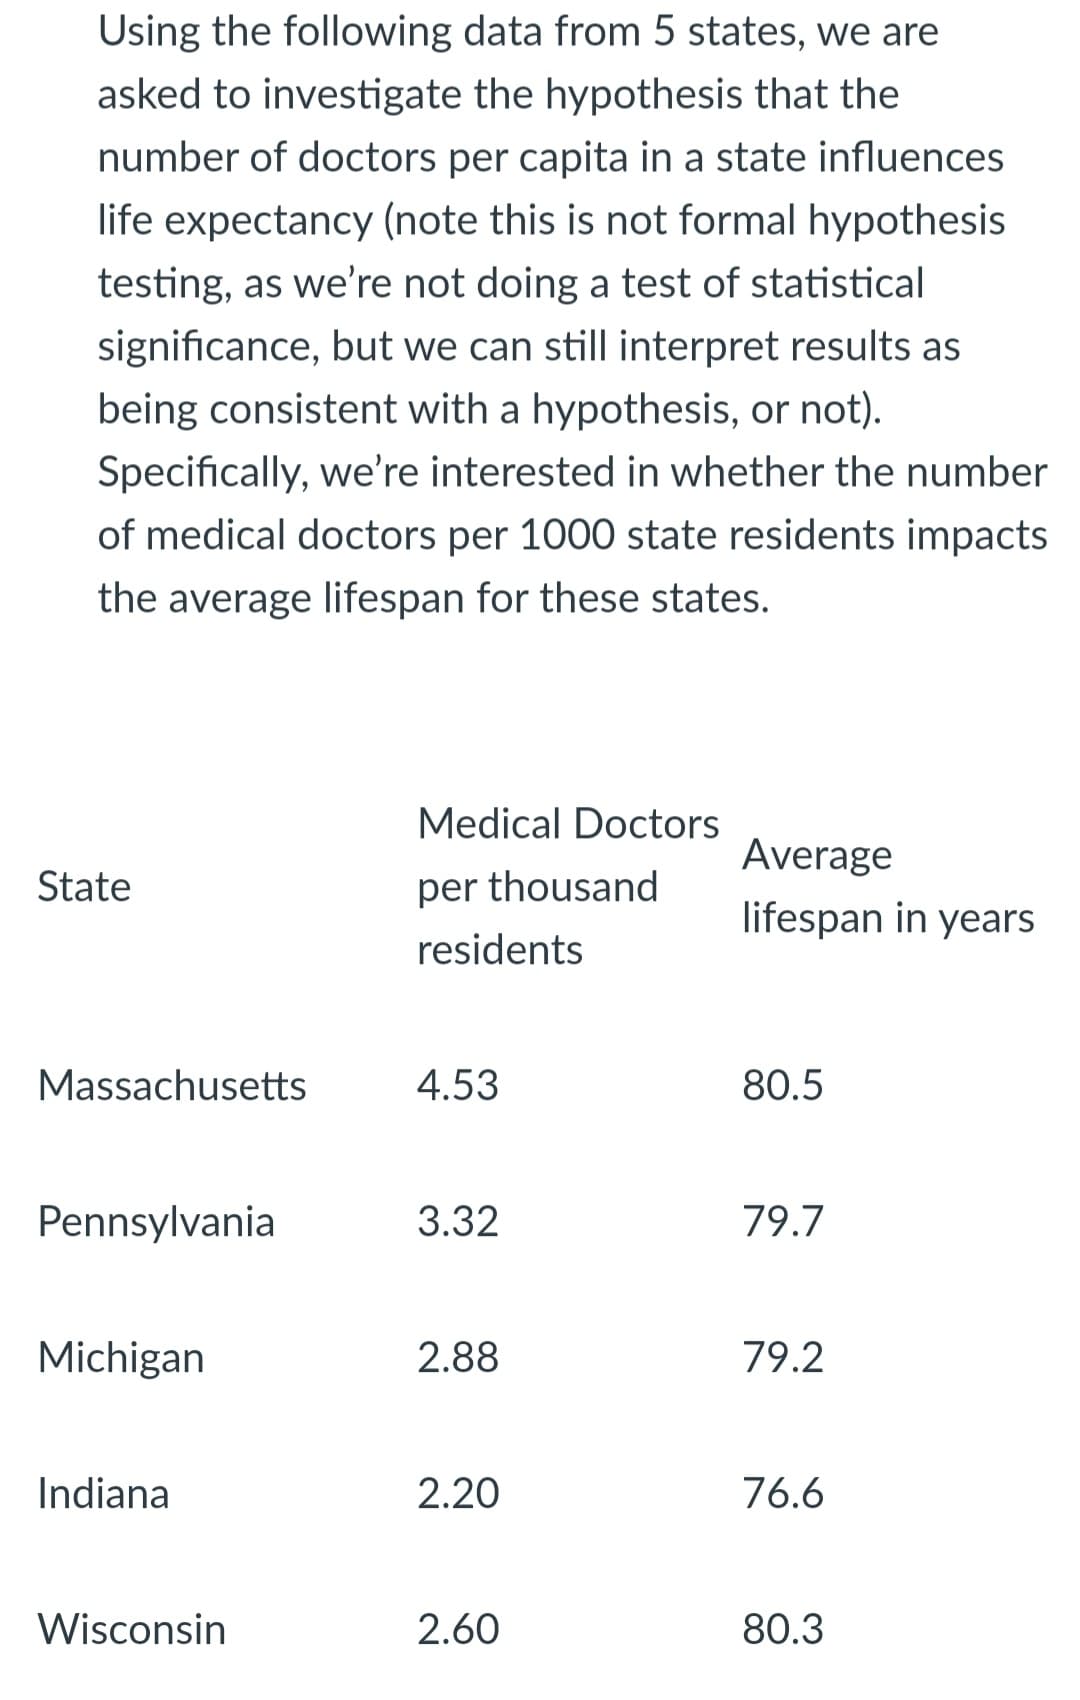
Using the following data from 5 states, we are asked to investigate the hypothesis that the number of doctors per capita in a state influences life expectancy (note this is not formal hypothesis testing, as we're not doing a test of statistical significance, but we can still interpret results as being consistent with a hypothesis, or not). Specifically, we're interested in whether the numbe of medical doctors per 1000 state residents impact the average lifespan for these states.
Using the following data from 5 states, we are asked to investigate the hypothesis that the number of doctors per capita in a state influences life expectancy (note this is not formal hypothesis testing, as we're not doing a test of statistical significance, but we can still interpret results as being consistent with a hypothesis, or not). Specifically, we're interested in whether the numbe of medical doctors per 1000 state residents impact the average lifespan for these states.

Glencoe Algebra 1, Student Edition, 9780079039897, 0079039898, 2018
18th Edition
ISBN:9780079039897
Author:Carter
Publisher:Carter
Chapter10: Statistics
Section: Chapter Questions
Problem 13PT

Related questions
Question
b) I need your help with the question attached. Thank you! (data and question attached)
Transcribed Image Text:Using the following data from 5 states, we are
asked to investigate the hypothesis that the
number of doctors per capita in a state influences
life expectancy (note this is not formal hypothesis
testing, as we're not doing a test of statistical
significance, but we can still interpret results as
being consistent with a hypothesis, or not).
Specifically, we're interested in whether the number
of medical doctors per 1000 state residents impacts
the average lifespan for these states.
Medical Doctors
Average
State
per thousand
lifespan in years
residents
Massachusetts
4.53
80.5
Pennsylvania
3.32
79.7
Michigan
2.88
79.2
Indiana
2.20
76.6
Wisconsin
2.60
80.3

Transcribed Image Text:b. Calculate the correlation between these two
variables.
Expert Solution
This question has been solved!
Explore an expertly crafted, step-by-step solution for a thorough understanding of key concepts.

Step by step
Solved in 2 steps

Knowledge Booster


Learn more about
Need a deep-dive on the concept behind this application? Look no further. Learn more about this topic, statistics and related others by exploring similar questions and additional content below.Recommended textbooks for you
Glencoe Algebra 1, Student Edition, 9780079039897…
Algebra
ISBN:
9780079039897
Author:
Carter
Publisher:
McGraw Hill

Holt Mcdougal Larson Pre-algebra: Student Edition…
Algebra
ISBN:
9780547587776
Author:
HOLT MCDOUGAL
Publisher:
HOLT MCDOUGAL

College Algebra (MindTap Course List)
Algebra
ISBN:
9781305652231
Author:
R. David Gustafson, Jeff Hughes
Publisher:
Cengage Learning
Glencoe Algebra 1, Student Edition, 9780079039897…
Algebra
ISBN:
9780079039897
Author:
Carter
Publisher:
McGraw Hill
Holt Mcdougal Larson Pre-algebra: Student Edition…
Algebra
ISBN:
9780547587776
Author:
HOLT MCDOUGAL
Publisher:
HOLT MCDOUGAL
College Algebra (MindTap Course List)
Algebra
ISBN:
9781305652231
Author:
R. David Gustafson, Jeff Hughes
Publisher:
Cengage Learning