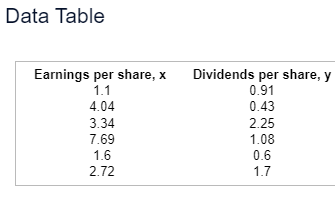
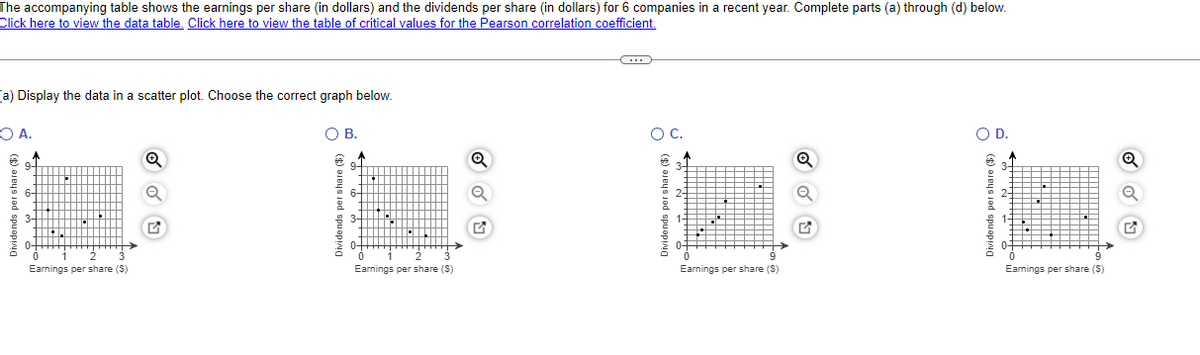
The accompanying table shows the earnings per share (in dollars) and the dividends per share (in dollars) for 6 companies in a recent year. Complete parts (a) through (d) below. Click here to view the data table, Click here to view the table of critical values for the Pearson correlation coefficient, a) Display the data in a scatter plot. Choose the correct graph below. O A. OB. OC. OD. %24 6- 6- 2. 2- 0+ Earnings per share (S) Earnings per share (S) Earnings per share (S) Earnings per share (S) Dividends per share ( Oividends per share ($) O


n alpha=0.05 alpha=0.01
4 0.950 0.990
5 0.878 0.959
6 0.811 0.917
7 0.754 0.875
8 0.707 0.834
9 0.666 0.798
10 0.632 0.765
11 0.602 0.735
12 0.576 0.708
13 0.553 0.684
14 0.532 0.661
15 0.514 0.641
16 0.497 0.623
17 0.482 0.606
18 0.468 0.590
19 0.456 0.575
20 0.444 0.561
21 0.433 0.549
22 0.423 0.537
23 0.413 0.526
24 0.404 0.515
25 0.396 0.505
26 0.388 0.496
27 0.381 0.487
28 0.374 0.479
29 0.367 0.471
30 0.361 0.463
35 0.334 0.430
40 0.312 0.403
45 0.294 0.380
50 0.279 0.361
55 0.266 0.345
60 0.254 0.330
65 0.244 0.317
70 0.235 0.306
75 0.227 0.296
80 0.220 0.286
85 0.213 0.278
90 0.207 0.270
95 0.202 0.263
100 0.197 0.256


Trending now
This is a popular solution!

Step by step
Solved in 5 steps with 2 images
