
MATLAB: An Introduction with Applications
6th Edition
ISBN: 9781119256830
Author: Amos Gilat
Publisher: John Wiley & Sons Inc
expand_more
expand_more
format_list_bulleted
Related questions
Question
Using the linear
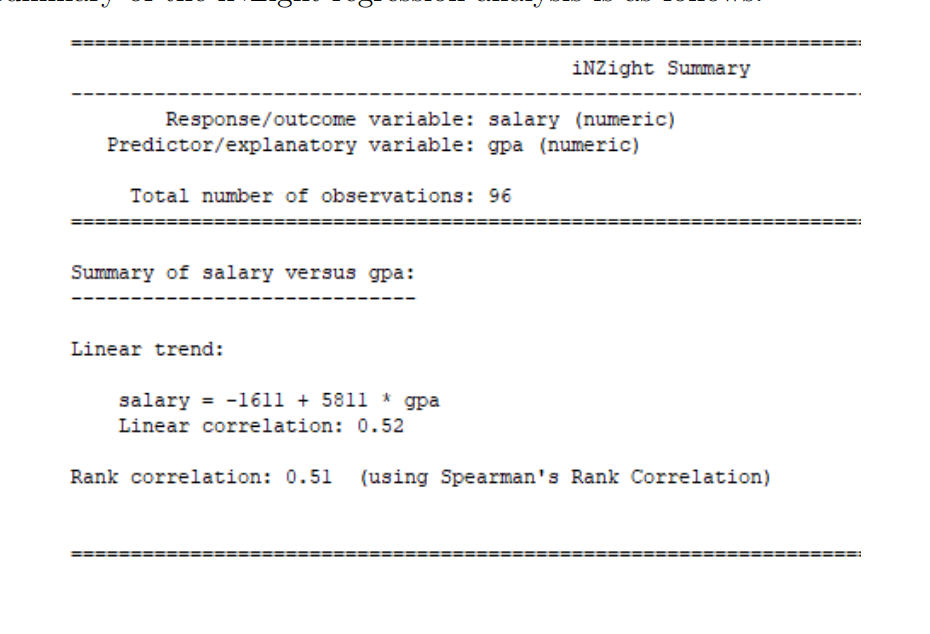

Transcribed Image Text:iNZight Summary
Response/outcome variable: salary (numeric)
Predictor/explanatory variable: gpa (numeric)
Total number of observations: 96
Summary of salary versus gpa:
Linear trend:
salary = -1611 + 581 *
gpa
Linear correlation: 0.52
Rank correlation: 0.51 (using Spearman's Rank Correlation)
%3D
%3D
%3D
%3D
%3D
%3D
%3D
%3D
%3D
%3D
%3D
%3D
%3D
%3D
%3D
%3D
II
Expert Solution
arrow_forward
Step 1
Obtain the value of r2.
The value of r2 is obtained below as follows:
From the given information, it is clear that the value of correlation coefficient is 0.52
The required value is,
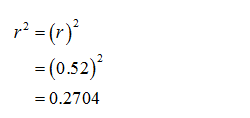
Thus, the value of r2 is 0.2704.

Step by stepSolved in 2 steps with 1 images

Knowledge Booster

Similar questions
- A correlation coefficient provides two pieces of information about a relationship between two variables. These are -Strength; direction of relationship - Direction, proportions - Direction, which one causes which - Which one causes which, effect size. READ FIRST: Show as much of your work in the text box below as possible, and include the rest in your scratch work. Scratch work supports what you write on this exam form. At the minimum, type your answers to each of the following 5 questions A-E in the text box - do not refer me to your scratch work for the answers. Do show your work (on the exam form or scratch work) for the calculations needed to answer B, so partial credit can be given in the case of a math error that throws off your calculations. The best way to do this is inside tables if possible. Total 10 15 You conduct a survey to find out whether talking on a cell phone during a romantic date bothers people. You want to find out if there is a gender difference on this issue,…arrow_forwardDetermine the type of direction of correlation that you would expect of the given case / situation. Speed of wind turbines and amount of electricity generated. no correlation positive correlation zero correlation negative correlationarrow_forwardChuck has noticed over the last several years that as he gets older, he also gets more politically conservative. What is the correlation between his age and his conservative leanings?Positive Negative Impossible to Determine ( don't hand writing solution)arrow_forward
- Find coefficient of association between literacy and employment and comment on your result using the following information. Total number of adults=1000,Total number of literates=129 Total number of unemployed=139,Total number of literates unemployed=82arrow_forwardThe correlation between a variable and itself is always equal to 0.5 -1 1arrow_forwardSummarize the definitions for linear correlation, quadratic correlations and exponential correlations. Provide an example graph of each of the types of correlation along with your summarized definitions.arrow_forward
- A random sample of college students was surveyed about how they spend their time each week. The scatterplot below displays the relationship between the number of hours each student typically works per week at a part- or full-time job and the number of hours of television each student typically watches per week. The correlation between these variables is r = –0.63, and the equation we would use to predict hours spent watching TV based on hours spent working is as follows: Predicted hours spent watching TV = 17.21 – 0.23(hours spent working) Since we are using hours spent working to help us predict hours spent watching TV, we’d call hours spent working a(n) __________________ variable and hours spent watching TV a(n) __________________ variable. The correlation coefficient, along with what we see in the scatterplot, tells us that the relationship between the variables has a direction that is _________________ and a strength that is ______________________. According to the…arrow_forwardDetermine if correlation between the two given variables is likely to be positive or negative, or if they are not likely to display a linear relationship. Your daily calorie intake and weight. (a) Positive (b) Negative (c) No correlationarrow_forwardWhich scatter plot shown has a correlation coefficient, r, closest to 0?arrow_forward
arrow_back_ios
SEE MORE QUESTIONS
arrow_forward_ios
Recommended textbooks for you
- MATLAB: An Introduction with ApplicationsStatisticsISBN:9781119256830Author:Amos GilatPublisher:John Wiley & Sons Inc
 Probability and Statistics for Engineering and th...StatisticsISBN:9781305251809Author:Jay L. DevorePublisher:Cengage Learning
 Statistics for The Behavioral Sciences (MindTap C...StatisticsISBN:9781305504912Author:Frederick J Gravetter, Larry B. WallnauPublisher:Cengage Learning
  Elementary Statistics: Picturing the World (7th E...StatisticsISBN:9780134683416Author:Ron Larson, Betsy FarberPublisher:PEARSON
 The Basic Practice of StatisticsStatisticsISBN:9781319042578Author:David S. Moore, William I. Notz, Michael A. FlignerPublisher:W. H. Freeman
 Introduction to the Practice of StatisticsStatisticsISBN:9781319013387Author:David S. Moore, George P. McCabe, Bruce A. CraigPublisher:W. H. Freeman
MATLAB: An Introduction with Applications
Statistics
ISBN:9781119256830
Author:Amos Gilat
Publisher:John Wiley & Sons Inc
Probability and Statistics for Engineering and th...
Statistics
ISBN:9781305251809
Author:Jay L. Devore
Publisher:Cengage Learning
Statistics for The Behavioral Sciences (MindTap C...
Statistics
ISBN:9781305504912
Author:Frederick J Gravetter, Larry B. Wallnau
Publisher:Cengage Learning
Elementary Statistics: Picturing the World (7th E...
Statistics
ISBN:9780134683416
Author:Ron Larson, Betsy Farber
Publisher:PEARSON
The Basic Practice of Statistics
Statistics
ISBN:9781319042578
Author:David S. Moore, William I. Notz, Michael A. Fligner
Publisher:W. H. Freeman
Introduction to the Practice of Statistics
Statistics
ISBN:9781319013387
Author:David S. Moore, George P. McCabe, Bruce A. Craig
Publisher:W. H. Freeman