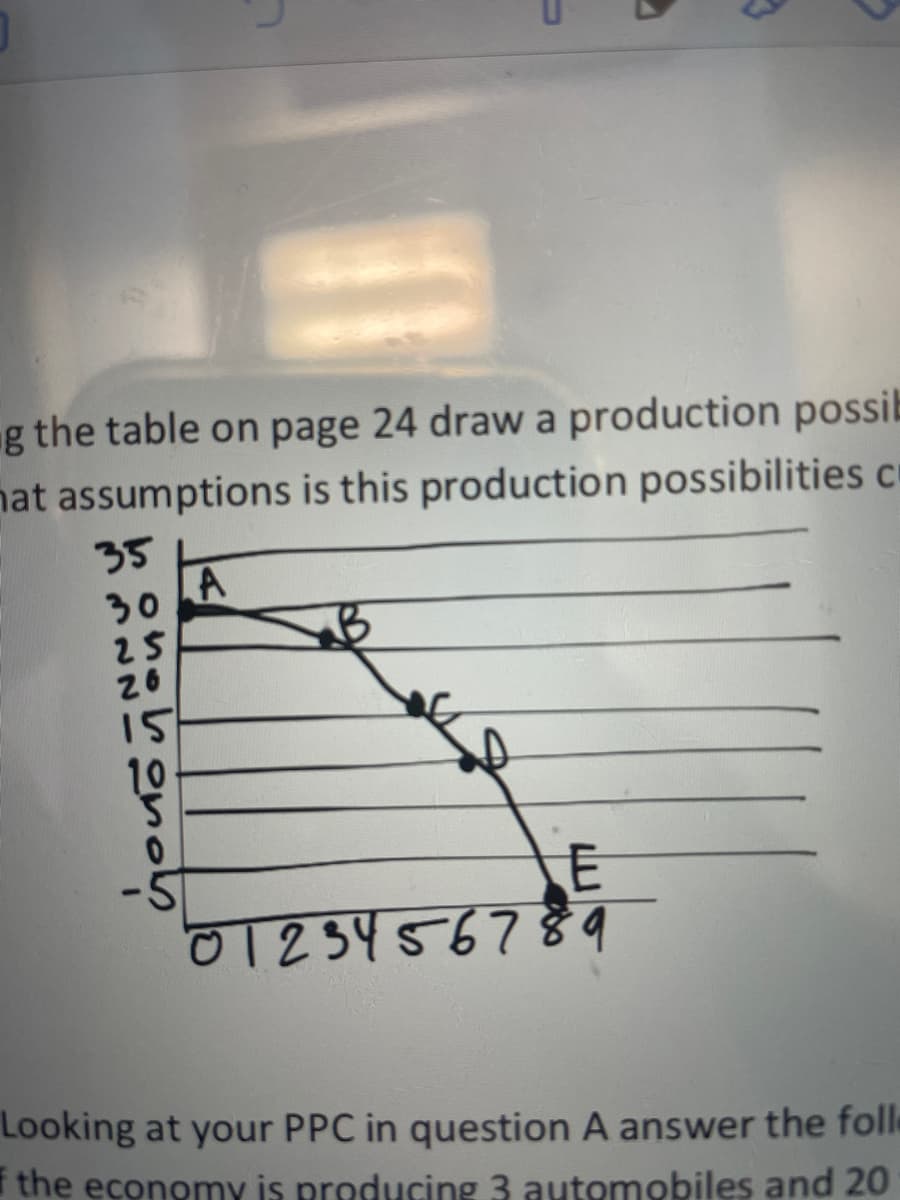
Using the PPC in question A answer the following questions (c,d) C. If the economy is producing 3 automobiles and 20 forklifts, what would you conclude about this economies use of resources? D) What would production at a point outside the PPC indicate?


Q: (also known as the production possibilities curve) for alfalfa, an agricultural good, and cars, a…
A: A production possibility curve (PPC) shows the maximum possible output combinations of two goods or…
Q: Answer the attached question
A: In an economy, the production possibility curve can have a parallel shift when the production of…
Q: Explain how each of the following situations would affect a nation's production possibilities curve.…
A: A Production possibility frontier (PPF) curve shows the different possible combination of two goods…
Q: On the following graph, use the blue line (circle symbol) to plot Felix's production possibilities…
A: Absolute advantage refers to the ability of an individual to produce more of the good than the other…
Q: Which of the following statements is incorrect regarding the PPF model? a. A decrease in resource…
A: A production possibility frontier (PPF) shows the maximum possible output combinations of two goods…
Q: A production possibilities table for two products, Consumption goods and Capital goods, is found…
A: The curve that depicts various quantities of goods and services being produced using the resources…
Q: Suppose that in the country of England, two goods can be produced on available agricultural land:…
A: *Quantity of wine when all resources are used to produce only wine = 200 *Quantity of wool when all…
Q: On the PPF above, the economy is currently at point B. How can the economy produce at point E? A. By…
A: Some useful concepts PPF : it shows different combinations of two goods that can be produced by…
Q: Labor productivity coefficients for the US and Brazil are given by the following table: Country…
A: Production Possibility Frontier Curve- The production possibility curve shows all possible…
Q: Referring to the given PPF, the movement from production at point a to production at point d…
A: PPF is the production possibilities frontier which is the locus of all the production points that…
Q: The following graph shows the production possibilities curve (PPC) of an economy that produces…
A: Opportunity Cost is the cost or value of doing something or of choosing an alternative. It can be…
Q: A production possibilities curve (PPC) represents the maximum amount of two goods or services…
A: Both PPC and LRAS curve reflect full capacity and resource utilization in the economy.
Q: 1. Discuss any five factors that may cause production possibility frontier (PPF) curve to shift. 2.…
A: Since you have posted multiple questions, we will solve the first question for you. If you want any…
Q: The following graph shows the production possibilities curve (also known as the production…
A: Production possibility curve is the curve which shows all possible combinations of two goods which a…
Q: Suppose Martha and Julia both work at a bakery making bread and muffins. In an hour, Martha can…
A: Comparative advantage is based on opportunity cost. Absolute advantage is based on the number of…
Q: Use the table to answer the question: Corn (lb) Scarves(#) U.S. 20 10 Mexico 25 5 What is the…
A: Opportunity costs represent the potential benefits a personal, investor, or business misses out on…
Q: Consider the PPF of a country with movies on the horizontal axis and computers on the vertical axis.…
A: Production Possibility Frontier refers to the curve that shows different possible combinations of…
Q: what accounts for the shape of the PPC? In other words, what is it about the relationship between…
A: The production possibility frontier (PPF) is a curve on a graph that delineates the potential…
Q: Answer the attached question
A: Production possibility frontier (PPF) refers to the combination of two goods that a country can…
Q: State three reasons for the PPF to shift to the right or left.
A: Production possibility frontier illustrates the combinations of quantity of two goods that can be…
Q: The blue (inner) curve on the following graph shows the current production possibilities curve (PPC)…
A: The production possibility curve (PPC) is a locus of the combination of two goods that an economy…
Q: Describe and indicate how each of the following would affect the U.S production possibilities…
A: Hello. Since you have posted multiple parts of the question and not specified which part of the…
Q: In this assignment, you will demonstrate your ability to draw a simple production possibilities…
A: 1. Scarcity exists as the nation has only 12 units of labor. Labor is needed for both gun and…
Q: Suppose Poland produces only cars and trucks. The resources that are used in the production of these…
A: Production Possibility Frontier PPF shows the combination of two products that can be produced using…
Q: Jason and Holly produce lollipops and chocolates. Their production possibilities are given by the…
A: The theory of comparative advantage suggests that countries should specialize in the production of…
Q: Hecksher-Ohlin Model Mexico and Brazil each make t-shirts and televisions. The two countries have…
A: Hecksher-Ohlin Model The model states that the country will export that good which comparatively…
Q: Draw a Production Possibilities Frontier curve for an economy that produces milk and cookies. What…
A: A production–possibility frontier (PPF), production possibility curve (PPC), production possibility…
Q: Which of the following is not true about the Production Possibility Curve? a) An inefficient use of…
A: Production possibility curve The production possibility curve depicts the combination of two goods…
Q: Diego and Darnell are roommates. They spend most of their time studying (of course), but they leave…
A: Meaning of Opportunity Cost: The term opportunity cost refers to the situation under which the…
Q: The figure above shows a country's production possibility frontier (PPFA). B A PPFA PPF The…
A: “Since you have asked multiple questions, we will solve the first question for you. If you want any…
Q: Robin and Betty can each pick mangoes and oranges. The following table summarises the time it takes…
A: Absolute advantage refers to the situation where one party can produce the same amount of goods and…
Q: What is Production possibility curve(PPC)? Draw a PPC in which vertical axis and horizontal axis…
A: A model which is bound to capture the opportunity costs and scarcity of choices while being faced…
Q: Consider a simple exchange economy with two people: Bob and Jake. Bob and Jake both have 10 hours of…
A: Comparative cost advantage: - it is a principle of international trade given by David Ricardo which…
Q: The United States and Canada both produce cars and beer. The table below shows the production…
A: Comparative advantage occurs when a country or an individual can produce the good at a lower…
Q: 4. An increase in the nation's capital stock will shift the PPC outward. move the nation from…
A: NOTE: We'll answer the first question, since the exact one isn't specified. Please submit a new…
Q: Using the information provided in the table below, answer the following questions. Country A…
A: PPF, production possibilities frontier shows different combinations of two goods that can be…
Q: A production possibilities table for two products, Consumption goods and Capital goods, is found…
A: "Since you have asked multiple questions, we will solve the first question for you. If you want any…
Q: Suppose Sarah and Julia both work at a bakery making bread and muffins. In an hour, Sarah can either…
A:
Q: Use a production possibilities frontier to describe the idea of trade-off.
A: Use a production possibilities frontier to describe the idea of trade-off. Let us define the…
Q: Use the PPF to answer the following questions: (a) At point F, how many sweaters are being…
A: Since you have posted a question with multiple sub-parts, we will solve first three subparts for…
Q: Y Y. Y (1) (2) (3) (4) 7. In the preceding figure, which graph depicts a technological breakthrough…
A: Production possibility frontier (PPF) curve shows different possible combination of two goods that…
Q: Homework (Ch 03) In the following table, enter each country's production decision on the third row…
A: A country or an individual is said to have a comparative advantage in a good if it can produce the…
Q: Suppose the United Kingdom produces two types of goods: agricultural and capital. The following…
A: The curve that depicts the quantities being produced possibly of the two products if both of them…
Q: The graph below represents a change to a PPF. Assume the production of cars is represented on the…
A: Production possibility frontier (PPF) shows a probable combination of two commodities produced in an…
Q: The United States and Canada both produce cars and beer. The table below shows the production…
A:
Q: (a) explain why the production combinations located on the PPC are superior to the combinations that…
A: Production Possibility curve (PPC) also known as Production Possibility Frontier is curve the shows…


Step by step
Solved in 2 steps


- POSSIBILITIES PINEAPPLES MANGOESA 100 0B 90 15C 70 30D 40 45E 0 60 1. Graph the production possibility frontier (PPF) placing pineapples on the X axis and mangoes on the Y axis. 2. On PPF curve drawn, identify the following points: i. Unattainable (label the point U) ii. Attainable and efficient (label the point AE) iii. Attainable and inefficient (label the point AI) 3. What does the shape of the PPF curve drawn suggest about the opportunity cost of producing ONE more unit of pineapples or mangoes 4. If mangoes harvesting increases from 15 to 30, what is the opportunity cost of harvesting pineapples? 5. What is the economic significance of choosing to harvest at 25 pineapples and 50 mangoes? 6. With the aid of a diagram, explain the effect of a new technological mobile weather station on…please solve d and e Imagine a country XYZ that produces only two goods—chairs and tables. Together, the chairs and tablesindustries use all of the economy’s factors of production. The table below shows the productionpossibilities for XYZ:Production Possibilities for XYZChairs Tables600 0450 150300 250150 325 0 375a. Draw a Production Possibility Frontier for the country using the information in tableabove. b. What is the opportunity cost of increasing chairs production from 450 chairs to 600chairs?c. What is the opportunity cost of increasing tables production from 250 tables to 325tables?d. Plot the point denoting 300 chairs and 300 tables on your graph above. Is this point“feasible”? Why or why not?e. Plot the point denoting 300 chairs and 50 tables on your graph above. Should XYZ beproducing at this point? Why or why not?Corn (lb) Scarves(#)U.S. 20 10Mexico 25 5 What is the opportunity cost of one lb of corn in U.S.? a. 1 scarf b. 2 scarves c. 0.5 scarves d. 1/4 scarf
- scenario Production Advantage and Opportunity CostsAssume there are two countries, the United States and France, and two goods, automobiles andcomputers.The table presented below shows the number of automobiles and computers that the United States andFrance can produce with the same amount of resources.United States FranceAutomobiles 120 100Computers 60 55Source: Pearson Education Inc. 1.1 Which country has an absolute advantage in computer production? Motivate your answer.1.2 Which country has a comparative advantage in the production of automobiles? Motivateyour answer. 1.3 Assume these countries trade with one another under the conditions of free trade. Whichcountry will specialise in the production of automobiles? Motivate your answer. 1.4 If free trade exists between the United States and France, what are the highest and lowestlevels for the price of an automobile (expressed in terms of computers)? Motivate youranswer by stating which level favours the United States and France.Imagine a country XYZ that produces only two goods—chairs and tables. Together, the chairs and tablesindustries use all of the economy’s factors of production. The table below shows the productionpossibilities for XYZ:Production Possibilities for XYZChairs Tables600 0450 150300 250150 325 0 375a. Draw a Production Possibility Frontier for the country using the information in tableabove. b. What is the opportunity cost of increasing chairs production from 450 chairs to 600chairs?c. What is the opportunity cost of increasing tables production from 250 tables to 325tables?d. Plot the point denoting 300 chairs and 300 tables on your graph above. Is this point“feasible”? Why or why not?e. Plot the point denoting 300 chairs and 50 tables on your graph above. Should XYZ beproducing at this point? Why or why not?Imagine a country XYZ that produces only two goods—chairs and tables. Together, the chairs and tablesindustries use all of the economy’s factors of production. The table below shows the productionpossibilities for XYZ:Production Possibilities for XYZChairs Tables600 0450 150300 250150 325 0 375 use the slope (rise/run) to solve it and describe what happen A. What is the opportunity cost of increasing tables production from 250 tables to 325tables? If I solve it by using slope method (250-325)/(300-150)=-0.5 is it correct? Because we should use slope method (Y2-Y1)/(X2-X1)
- Imagine a country XYZ that produces only two goods—chairs and tables. Together, the chairs and tablesindustries use all of the economy’s factors of production. The table below shows the productionpossibilities for XYZ:Production Possibilities for XYZChairs Tables600 0450 150300 250150 325 0 375 use the slope (rise/run) to solve it and describe what happen a. What is the opportunity cost of increasing chairs production from 450 chairs to 600chairs? b. What is the opportunity cost of increasing tables production from 250 tables to 325tables?Production Advantage and Opportunity CostsAssume there are two countries, the United States and France, and two goods, automobiles andcomputers.The table presented below shows the number of automobiles and computers that the United States andFrance can produce with the same amount of resources.United States FranceAutomobiles 120 100Computers 60 55Source: Pearson Education Inc. 1.1 Which country has an absolute advantage in computer production? Motivate your answer.1.2 Which country has a comparative advantage in the production of automobiles? Motivateyour answer. 1.3 Assume these countries trade with one another under the conditions of free trade. Whichcountry will specialise in the production of automobiles? Motivate your answer. 1.4 If free trade exists between the United States and France, what are the highest and lowestlevels for the price of an automobile (expressed in terms of computers)? Motivate youranswer by stating which level favours the United States and France.The Marope Economy has the capacity to produce the goods and services that are outlined in Table 1 below. You are required to:a. Draw a Production Possibility Frontier (PPF) and list all efficient points of production.b. Marope Economy wishes to produce 520 billion units of consumer goods. Plot this output onthe Frontier and state whether this is an efficient point or not.Table 1 – Production Possibilities Output (billions of units per year) Consumer goods Consumer servicesPart BA B480 420 0 120C D240 0 240 300 Use graphs to demonstrate how the following factors will change the PPF.a. A decrease in migrationb. An increase in natural resourcesc. Changes in technology
- Review the numbers for Canada and Venezuelafrom Table 33.12 which describes how many barrelsof oil and tons of lumber the workers can produce. Usethese numbers to answer the rest of this question.a. Draw a production possibilities frontier for eachcountry. Assume there are 100 workers in eachcountry. Canadians and Venezuelans desire bothoil and lumber. Canadians want at least 2,000tons of lumber. Mark a point on their productionpossibilities where they can get at least 3,000tons.b. Assume that the Canadians specializecompletely because they figured out they havea comparative advantage in lumber. They arewilling to give up 1,000 tons of lumber. Howmuch oil should they ask for in return for thislumber to be as well off as they were with notrade? How much should they ask for if theywant to gain from trading with Venezuela? Note:We can think of this “ask” as the relative price ortrade price of lumber.c. Is the Canadian “ask” you identified in (b) alsobeneficial for Venezuelans? Use the…2. Your opportunity cost of going to a movie isa. thepriceoftheticket.b. thepriceoftheticketplusthecostofanysodaandpFigure 1 below shows two production possibilies frontiers (PPFs). The solid one isthe original one. The dashed one is the PPF after a technological advance that hasbenefitted only the Y indusry. As an example, think of the invention of fruitpicking robots that benefits only agricultural production and is of no use insoftware production.Figure 2 shows the marginal social benefit (MSB) of X production in terms ofsacrifices of Y. For example, to produce the first unit of X, the society is willing togive up 40 units of Y. For the second unit the socirty is willing to sacrifice only 35units of Y.Before the technological advance:1. What are the marginal social costs (MSCs) of producing the second,third, and the fourth units of X in terms of the sacrifices of Y. Do youremember the reasons for these results?2. What are the allocatively efficient quantities of X and Y?3. Suppose that due to some good news about various health benefits of X,the marginal social benefit of X increases by 10 units…

