Using the three-point curved line drawing tool, show how the following event will impact the economy's short-run aggregate supply (AS) curve. Properly label this curve. 12- 11- Event: High taxes and excessive regulation cause firms to reduce the quantity of their physical capital. 10- 9- Note: Carefully follow the instructions above and only draw the required object. 8- 5- 4- 3- 2- 1- 9. 10 Aggregate output (income), Y Price level, P
Using the three-point curved line drawing tool, show how the following event will impact the economy's short-run aggregate supply (AS) curve. Properly label this curve. 12- 11- Event: High taxes and excessive regulation cause firms to reduce the quantity of their physical capital. 10- 9- Note: Carefully follow the instructions above and only draw the required object. 8- 5- 4- 3- 2- 1- 9. 10 Aggregate output (income), Y Price level, P

Chapter11: Managing Aggregate Demand: Fiscal Policy
Section: Chapter Questions
Problem 5DQ

Related questions
Question
100%
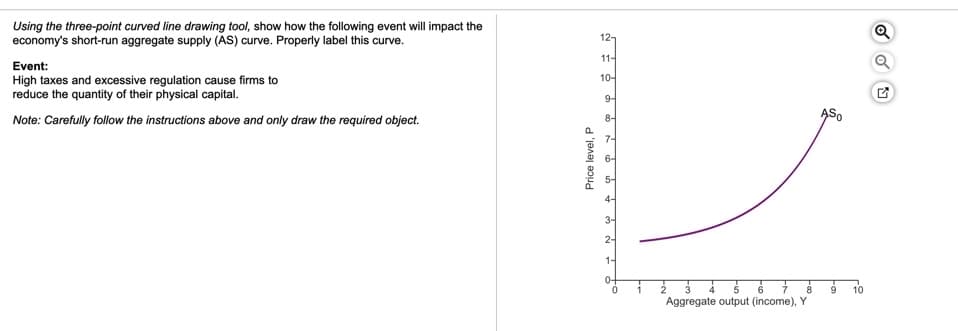
Transcribed Image Text:Using the three-point curved line drawing tool, show how the following event will impact the
economy's short-run aggregate supply (AS) curve. Properly label this curve.
12-
11-
Event:
10-
High taxes and excessive regulation cause firms to
reduce the quantity of their physical capital.
9-
Note: Carefully follow the instructions above and only draw the required object.
ASO
8-
4-
3-
2-
1-
0-
10
Aggregate output (income), Y
Price level, P
Expert Solution
This question has been solved!
Explore an expertly crafted, step-by-step solution for a thorough understanding of key concepts.

This is a popular solution!

Trending now
This is a popular solution!

Step by step
Solved in 2 steps with 1 images

Knowledge Booster


Learn more about
Need a deep-dive on the concept behind this application? Look no further. Learn more about this topic, economics and related others by exploring similar questions and additional content below.Recommended textbooks for you


Macroeconomics: Private and Public Choice (MindTa…
Economics
ISBN:
9781305506756
Author:
James D. Gwartney, Richard L. Stroup, Russell S. Sobel, David A. Macpherson
Publisher:
Cengage Learning

Economics: Private and Public Choice (MindTap Cou…
Economics
ISBN:
9781305506725
Author:
James D. Gwartney, Richard L. Stroup, Russell S. Sobel, David A. Macpherson
Publisher:
Cengage Learning