Weatherwise is a magazine published by the American Meteorological Society. One issue gives a rating system used to classify Nor'easter storms that frequently hit New England and can cause much damage near the ocean. A severe storm has an average peak wave height of u = 16.4 feet for waves hitting the shore. Suppose that a Nor'easter is in progress at the severe storm class rating. Peak wave heights are usually measured from land (using binoculars) off fixed cement piers. Suppose that a reading of 36 waves showed an average wave height of x = 17.3 feet. Previous studies of severe storms indicate that o = 3.5 feet. Does this information suggest that the storm is (perhaps temporarily) increasing above the severe rating? Use a = 0.01. (a) What is the level of significance? State the null and alternate hypotheses. O Ho: H > 16.4 ft; H1: µ = 16.4 ft O Ho: H < 16.4 ft; H1: µ = 16.4 ft O Họ: H = 16.4 ft; H1: H * 16.4 ft O Ho: H = 16.4 ft; H1: u > 16.4 ft O Ho: H = 16.4 ft; H1: H < 16.4 ft (b) What sampling distribution will you use? Explain the rationale for your choice of sampling distribution. O The standard normal, since the sample size is large and o is unknown. O The Student's t, since the sample size is large and o is unknown. O The standard normal, since the sample size is large and o is known. O The Student's t, since the sample size is large and o is known. What is the value of the sample test statistic? (Round your answer to two decimal places.) (c) Estimate the P-value. O P-value > 0.250 O 0.100 < P-value < 0.250 O 0.050 < P-value < 0.100 O 0.010 < P-value < 0.050 O P-value < 0.010
Weatherwise is a magazine published by the American Meteorological Society. One issue gives a rating system used to classify Nor'easter storms that frequently hit New England and can cause much damage near the ocean. A severe storm has an average peak wave height of u = 16.4 feet for waves hitting the shore. Suppose that a Nor'easter is in progress at the severe storm class rating. Peak wave heights are usually measured from land (using binoculars) off fixed cement piers. Suppose that a reading of 36 waves showed an average wave height of x = 17.3 feet. Previous studies of severe storms indicate that o = 3.5 feet. Does this information suggest that the storm is (perhaps temporarily) increasing above the severe rating? Use a = 0.01. (a) What is the level of significance? State the null and alternate hypotheses. O Ho: H > 16.4 ft; H1: µ = 16.4 ft O Ho: H < 16.4 ft; H1: µ = 16.4 ft O Họ: H = 16.4 ft; H1: H * 16.4 ft O Ho: H = 16.4 ft; H1: u > 16.4 ft O Ho: H = 16.4 ft; H1: H < 16.4 ft (b) What sampling distribution will you use? Explain the rationale for your choice of sampling distribution. O The standard normal, since the sample size is large and o is unknown. O The Student's t, since the sample size is large and o is unknown. O The standard normal, since the sample size is large and o is known. O The Student's t, since the sample size is large and o is known. What is the value of the sample test statistic? (Round your answer to two decimal places.) (c) Estimate the P-value. O P-value > 0.250 O 0.100 < P-value < 0.250 O 0.050 < P-value < 0.100 O 0.010 < P-value < 0.050 O P-value < 0.010

Mathematics For Machine Technology
8th Edition
ISBN:9781337798310
Author:Peterson, John.
Publisher:Peterson, John.
Chapter29: Tolerance, Clearance, And Interference
Section: Chapter Questions
Problem 18A: A piece is to be cut to the dimensions and tolerances shown in Figure 29-14. Determine the maximum...

Related questions
Question
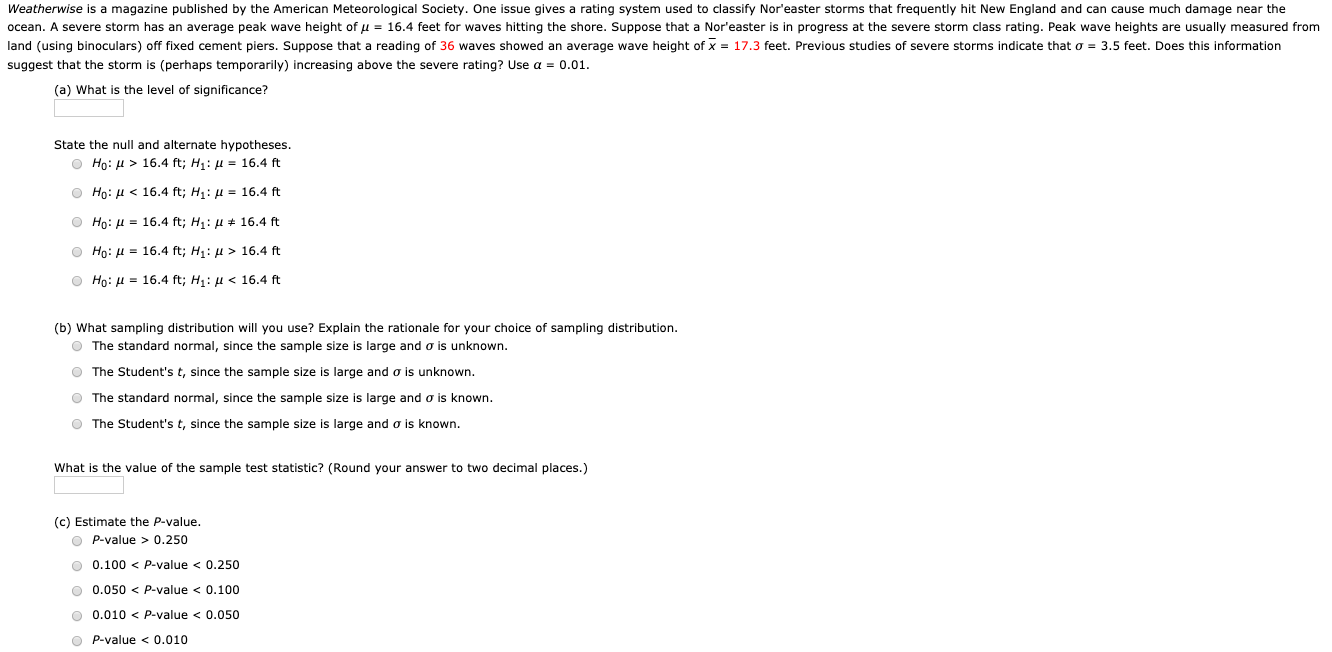
Transcribed Image Text:Weatherwise is a magazine published by the American Meteorological Society. One issue gives a rating system used to classify Nor'easter storms that frequently hit New England and can cause much damage near the
ocean. A severe storm has an average peak wave height of u = 16.4 feet for waves hitting the shore. Suppose that a Nor'easter is in progress at the severe storm class rating. Peak wave heights are usually measured from
land (using binoculars) off fixed cement piers. Suppose that a reading of 36 waves showed an average wave height of x = 17.3 feet. Previous studies of severe storms indicate that o = 3.5 feet. Does this information
suggest that the storm is (perhaps temporarily) increasing above the severe rating? Use a = 0.01.
(a) What is the level of significance?
State the null and alternate hypotheses.
O Ho: H > 16.4 ft; H1: µ = 16.4 ft
O Ho: H < 16.4 ft; H1: µ = 16.4 ft
O Họ: H = 16.4 ft; H1: H * 16.4 ft
O Ho: H = 16.4 ft; H1: u > 16.4 ft
O Ho: H = 16.4 ft; H1: H < 16.4 ft
(b) What sampling distribution will you use? Explain the rationale for your choice of sampling distribution.
O The standard normal, since the sample size is large and o is unknown.
O The Student's t, since the sample size is large and o is unknown.
O The standard normal, since the sample size is large and o is known.
O The Student's t, since the sample size is large and o is known.
What is the value of the sample test statistic? (Round your answer to two decimal places.)
(c) Estimate the P-value.
O P-value > 0.250
O 0.100 < P-value < 0.250
O 0.050 < P-value < 0.100
O 0.010 < P-value < 0.050
O P-value < 0.010
Expert Solution
This question has been solved!
Explore an expertly crafted, step-by-step solution for a thorough understanding of key concepts.

This is a popular solution!

Trending now
This is a popular solution!

Step by step
Solved in 3 steps with 4 images

Recommended textbooks for you
Mathematics For Machine Technology
Advanced Math
ISBN:
9781337798310
Author:
Peterson, John.
Publisher:
Cengage Learning,

Elementary Geometry for College Students
Geometry
ISBN:
9781285195698
Author:
Daniel C. Alexander, Geralyn M. Koeberlein
Publisher:
Cengage Learning

Algebra: Structure And Method, Book 1
Algebra
ISBN:
9780395977224
Author:
Richard G. Brown, Mary P. Dolciani, Robert H. Sorgenfrey, William L. Cole
Publisher:
McDougal Littell
Mathematics For Machine Technology
Advanced Math
ISBN:
9781337798310
Author:
Peterson, John.
Publisher:
Cengage Learning,
Elementary Geometry for College Students
Geometry
ISBN:
9781285195698
Author:
Daniel C. Alexander, Geralyn M. Koeberlein
Publisher:
Cengage Learning
Algebra: Structure And Method, Book 1
Algebra
ISBN:
9780395977224
Author:
Richard G. Brown, Mary P. Dolciani, Robert H. Sorgenfrey, William L. Cole
Publisher:
McDougal Littell

Glencoe Algebra 1, Student Edition, 9780079039897…
Algebra
ISBN:
9780079039897
Author:
Carter
Publisher:
McGraw Hill