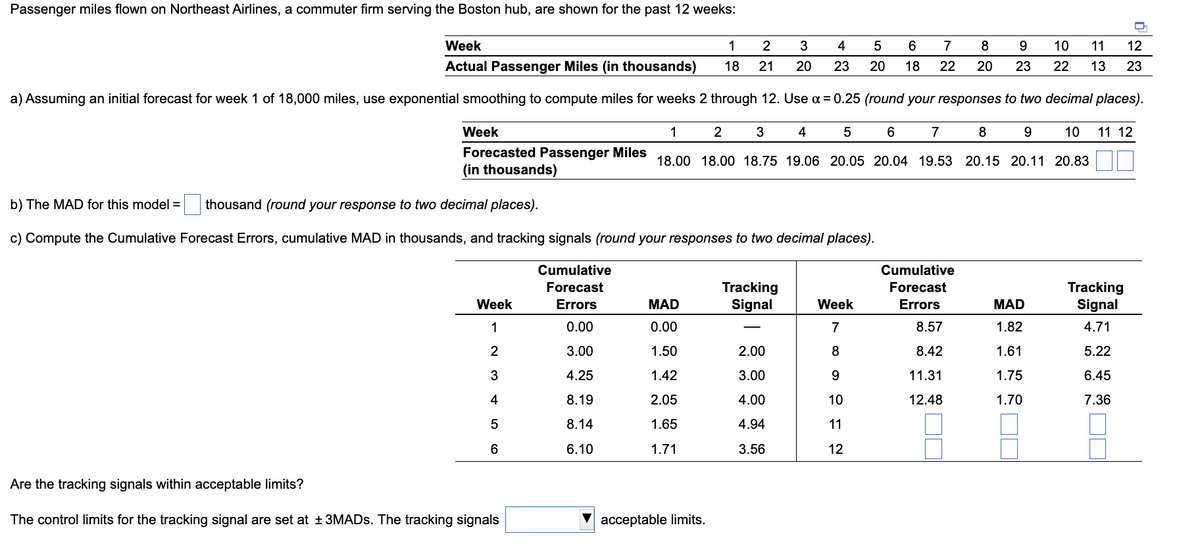
Week 1 2 3 4 Actual Passenger Miles (in thousands) 18 21 20 23 a) Assuming an initial forecast for week 1 of 18,000 miles, use exponential smoothing to compute miles for weeks 2 through 12. Use α = 0.25 (round your responses to two decimal places). Week 1 2 3 4 5 6 7 8 9 10 11 12 Forecasted Passenger Miles 18.00 18.00 18.75 19.06 20.05 20.04 19.53 20.15 20.11 20.83 (in thousands) b) The MAD for this model = thousand (round your response to two decimal places). c) Compute the Cumulative Forecast Errors, cumulative MAD in thousands, and tracking signals (round your responses to two decimal places). Cumulative Forecast Errors 0.00 3.00 4.25 8.19 8.14 6.10 Are the tracking signals within acceptable limits? Week 1 2 3 4 5 6 MAD 0.00 1.50 1.42 2.05 1.65 1.71 Tracking Signal 2.00 3.00 4.00 4.94 3.56 5 20 Week 7 8 9 10 11 12 6 18 7 22 Cumulative Forecast Errors 8.57 8.42 11.31 12.48 8 20 9 10 23 11 22 13 MAD 1.82 1.61 1.75 1.70 Tracking Signal 4.71 5.22 6.45 7.36 12 23

Purchasing and Supply Chain Management
6th Edition
ISBN:9781285869681
Author:Robert M. Monczka, Robert B. Handfield, Larry C. Giunipero, James L. Patterson
Publisher:Robert M. Monczka, Robert B. Handfield, Larry C. Giunipero, James L. Patterson
ChapterC: Cases
Section: Chapter Questions
Problem 5.1SC: Scenario 3 Ben Gibson, the purchasing manager at Coastal Products, was reviewing purchasing...
icon
Related questions
Question

The estimated times and immediate predecessors for the activities in a project at Howard​ Umrah's retinal scanning company are given in the following table. Assume that the activity times are independent.

                                                                                                                                                                Passenger miles flown on Northeast​ Airlines, a commuter firm serving the Boston​ hub, are shown for the past 12​ weeks:


Week

1

2

3

4

5

6

7

8

9

10

11

12

Actual Passenger Miles​ (in thousands)

18

21

20

23

20

18

22

20

23

22

13

23

Part 2

​a) Assuming an initial forecast for week 1 of


18,000 ​miles, use exponential smoothing to compute miles for weeks 2 through 12. Use


α


=


0.25 ​(round your responses to two decimal​ places).


Part 3

​b) The MAD for this model


=


enter your response here

thousand ​(round your response to two decimal​ places).

Part 4

​c) Compute the Cumulative Forecast​ Errors, cumulative MAD in​ thousands, and tracking signals ​(round your responses to two decimal​ places).


Week

Cumulative Forecast Errors


MAD

Tracking Signal

Week

Cumulative Forecast Errors


MAD

Tracking Signal

1

0.00


0.00

7

8.57


1.82

4.71

2

3.00


1.50

2.00

8

8.42


1.61

5.22

Part 5

Are the tracking signals within acceptable​ limits?


The control limits for the tracking signal are set at


±


3MADs. The tracking signals


are not within

are within

acceptable limits.


NePassenger miles flown on Northeast​ Airlines, a commuter firm serving the Boston​ hub, are shown for the past 12​ weeks:


Week

1

2

3

4

5

6

7

8

9

10

11

12

Actual Passenger Miles​ (in thousands)

18

21

20

23

20

18

22

20

23

22

13

23

Part 2

​a) Assuming an initial forecast for week 1 of


18,000 ​miles, use exponential smoothing to compute miles for weeks 2 through 12. Use


α


=


0.25 ​(round your responses to two decimal​ places).


Part 3

​b) The MAD for this model


=


enter your response here

thousand ​(round your response to two decimal​ places).

Part 4

​c) Compute the Cumulative Forecast​ Errors, cumulative MAD in​ thousands, and tracking signals ​(round your responses to two decimal​ places).


Week

Cumulative Forecast Errors


MAD

Tracking Signal

Week

Cumulative Forecast Errors


MAD

Tracking Signal

1

0.00


0.00

7

8.57


1.82

4.71

2

3.00


1.50

2.00

8

8.42


1.61

5.22

Part 5

Are the tracking signals within acceptable​ limits?


The control limits for the tracking signal are set at


±


3MADs. The tracking signals


are not within

are within

acceptable limits.


Passenger miles flown on Northeast Airlines, a commuter firm serving the Boston hub, are shown for the past 12 weeks:
Week
1
2
Actual Passenger Miles (in thousands) 18 21
a) Assuming an initial forecast for week 1 of 18,000 miles, use exponential smoothing to compute miles for weeks 2 through 12. Use α = 0.25 (round your responses to two decimal places).
1
2 3 4 5 6 7 8 9
18.00 18.00 18.75 19.06 20.05 20.04 19.53 20.15 20.11 20.83
Week
Forecasted Passenger Miles
(in thousands)
Week
1
2
3
4
5
6
b) The MAD for this model = thousand (round your response to two decimal places).
c) Compute the Cumulative Forecast Errors, cumulative MAD in thousands, and tracking signals (round your responses to two decimal places).
Cumulative
Forecast
Errors
0.00
3.00
4.25
8.19
8.14
6.10
Are the tracking signals within acceptable limits?
The control limits for the tracking signal are set at ±3MADs. The tracking signals
MAD
0.00
1.50
1.42
2.05
1.65
1.71
acceptable limits.
Tracking
Signal
4
3
20 23
2.00
3.00
4.00
4.94
3.56
5 6
20 18
Week
7
8
9
10
11
12
7
22
Cumulative
Forecast
Errors
8.57
8.42
11.31
12.48
8
9
20 23
MAD
1.82
1.61
1.75
1.70
11 12
10
22 13 23
10 11 12
Tracking
Signal
4.71
5.22
6.45
7.36
Transcribed Image Text:Passenger miles flown on Northeast Airlines, a commuter firm serving the Boston hub, are shown for the past 12 weeks: Week 1 2 Actual Passenger Miles (in thousands) 18 21 a) Assuming an initial forecast for week 1 of 18,000 miles, use exponential smoothing to compute miles for weeks 2 through 12. Use α = 0.25 (round your responses to two decimal places). 1 2 3 4 5 6 7 8 9 18.00 18.00 18.75 19.06 20.05 20.04 19.53 20.15 20.11 20.83 Week Forecasted Passenger Miles (in thousands) Week 1 2 3 4 5 6 b) The MAD for this model = thousand (round your response to two decimal places). c) Compute the Cumulative Forecast Errors, cumulative MAD in thousands, and tracking signals (round your responses to two decimal places). Cumulative Forecast Errors 0.00 3.00 4.25 8.19 8.14 6.10 Are the tracking signals within acceptable limits? The control limits for the tracking signal are set at ±3MADs. The tracking signals MAD 0.00 1.50 1.42 2.05 1.65 1.71 acceptable limits. Tracking Signal 4 3 20 23 2.00 3.00 4.00 4.94 3.56 5 6 20 18 Week 7 8 9 10 11 12 7 22 Cumulative Forecast Errors 8.57 8.42 11.31 12.48 8 9 20 23 MAD 1.82 1.61 1.75 1.70 11 12 10 22 13 23 10 11 12 Tracking Signal 4.71 5.22 6.45 7.36
Expert Solution
trending now

Trending now

This is a popular solution!

steps

Step by step

Solved in 5 steps with 3 images

Blurred answer
Similar questions
  • SEE MORE QUESTIONS
Recommended textbooks for you
Purchasing and Supply Chain Management
Operations Management
ISBN:
9781285869681
Author:
Robert M. Monczka, Robert B. Handfield, Larry C. Giunipero, James L. Patterson
Publisher:
Cengage Learning
Contemporary Marketing
Marketing
ISBN:
9780357033777
Author:
Louis E. Boone, David L. Kurtz
Publisher:
Cengage Learning
Marketing
Marketing
Marketing
ISBN:
9780357033791
Author:
Pride, William M
Publisher:
South Western Educational Publishing