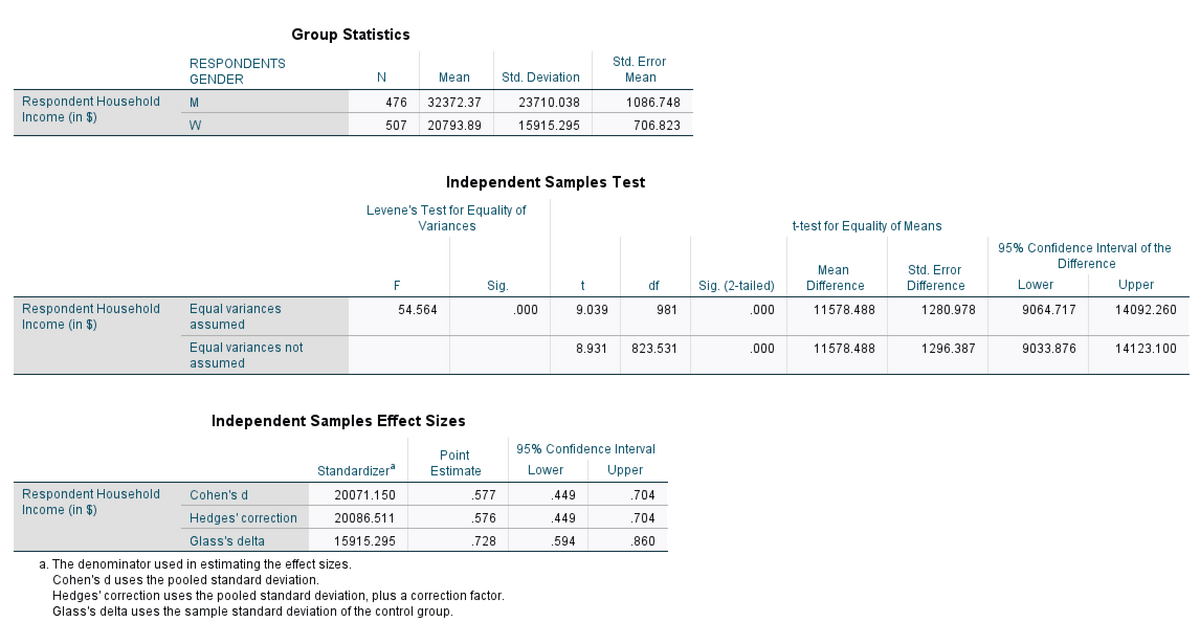
What does it mean if two samples are significantly different from each other? What does it mean if they are not significantly different? -Economists say women make less than men in the United States by a wide margin. Do we find the same thing? What about income differences between White and Black Americans in the U.S.? How does our data fit with our understanding of pay discrepancies?
What does it mean if two samples are significantly different from each other? What does it mean if they are not significantly different? -Economists say women make less than men in the United States by a wide margin. Do we find the same thing? What about income differences between White and Black Americans in the U.S.? How does our data fit with our understanding of pay discrepancies?

Glencoe Algebra 1, Student Edition, 9780079039897, 0079039898, 2018
18th Edition
ISBN:9780079039897
Author:Carter
Publisher:Carter
Chapter10: Statistics
Section10.4: Distributions Of Data
Problem 19PFA

Related questions
Question
-What does it mean if two samples are significantly different from each other? What does it mean if they are not significantly different?
-Economists say women make less than men in the United States by a wide margin. Do we find the same thing? What about income differences between White and Black Americans in the U.S.? How does our data fit with our understanding of pay discrepancies?
in reference to t tests
use graph to answer questoins
Transcribed Image Text:Group Statistics
RESPONDENTS
Std. Error
GENDER
N
Mean
Std. Deviation
Mean
Respondent Household
Income (in $)
M
476
32372.37
23710.038
1086.748
W
507
20793.89
15915.295
706.823
Independent Samples Test
Levene's Test for Equality of
Variances
t-test for Equality of Means
95% Confidence Interval of the
Difference
Mean
Std. Error
F
Sig.
df
Sig. (2-tailed)
Difference
Difference
Lower
Upper
Respondent Household
Income (in $)
Equal variances
54.564
.000
9.039
981
.000
11578.488
1280.978
9064.717
14092.260
assumed
Equal variances not
8.931
823.531
.000
11578.488
1296.387
9033.876
14123.100
assumed
Independent Samples Effect Sizes
95% Confidence Interval
Point
Standardizer
Estimate
Lower
Upper
Respondent Household
Income (in $)
Cohen's d
20071.150
.577
.449
.704
Hedges'correction
20086.511
.576
.449
.704
Glass's delta
15915.295
.728
.594
.860
a. The denominator used in estimating the effect sizes.
Cohen's d uses the pooled standard deviation.
Hedges' correction uses the pooled standard deviation, plus a correction factor.
Glass's delta uses the sample standard deviation of the control group.
Expert Solution
This question has been solved!
Explore an expertly crafted, step-by-step solution for a thorough understanding of key concepts.

This is a popular solution!

Trending now
This is a popular solution!

Step by step
Solved in 3 steps

Recommended textbooks for you
Glencoe Algebra 1, Student Edition, 9780079039897…
Algebra
ISBN:
9780079039897
Author:
Carter
Publisher:
McGraw Hill
Glencoe Algebra 1, Student Edition, 9780079039897…
Algebra
ISBN:
9780079039897
Author:
Carter
Publisher:
McGraw Hill