What is the following graph in generalized linear model? Explain what things went wrong. What do you expect in the graph for a perfect model? Scale-Location 0517 2. O00 00 8. 9.5 10.0 10.5 11.0 8.5 9.0 Predicted values Vistd. deviance resid. 0.5 1.5
What is the following graph in generalized linear model? Explain what things went wrong. What do you expect in the graph for a perfect model? Scale-Location 0517 2. O00 00 8. 9.5 10.0 10.5 11.0 8.5 9.0 Predicted values Vistd. deviance resid. 0.5 1.5

Trigonometry (MindTap Course List)
8th Edition
ISBN:9781305652224
Author:Charles P. McKeague, Mark D. Turner
Publisher:Charles P. McKeague, Mark D. Turner
Chapter4: Graphing And Inverse Functions
Section: Chapter Questions
Problem 6GP: If your graphing calculator is capable of computing a least-squares sinusoidal regression model, use...

Related questions
Question
2
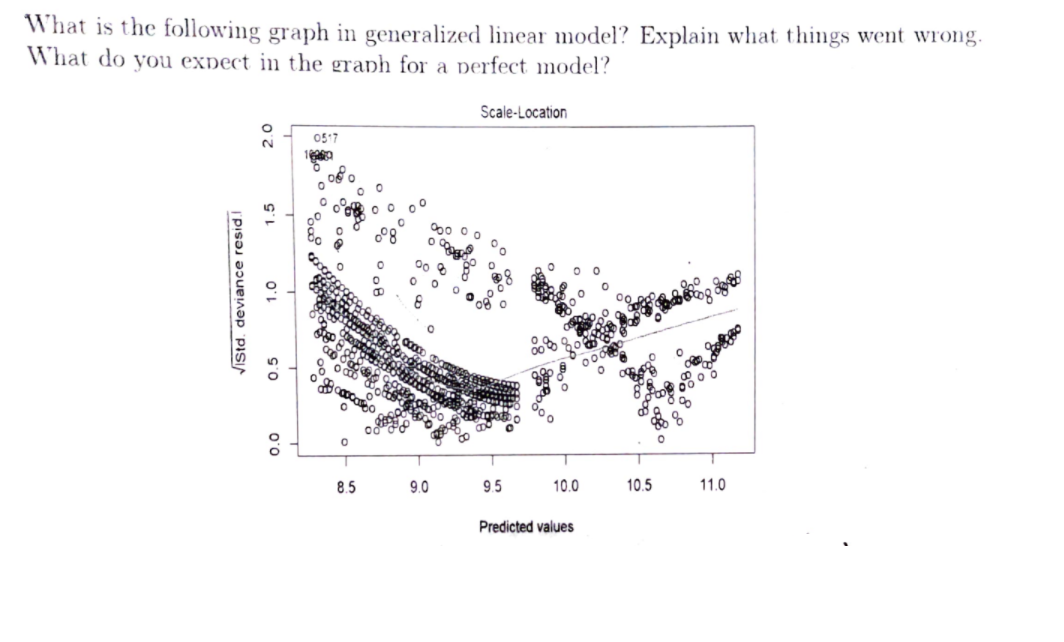
Transcribed Image Text:What is the following graph in generalized linear model? Explain what things went wrong.
What do you expect in the graph for a perfect model?
Scale-Location
0517
2.
O00 00 0e
8.5
9.0
9.5
10.0
10.5
11.0
Predicted values
ViStd, deviance resid.I
0.5
O'l
Expert Solution
This question has been solved!
Explore an expertly crafted, step-by-step solution for a thorough understanding of key concepts.

Step by step
Solved in 3 steps with 3 images

Recommended textbooks for you
Trigonometry (MindTap Course List)
Trigonometry
ISBN:
9781305652224
Author:
Charles P. McKeague, Mark D. Turner
Publisher:
Cengage Learning


Mathematics For Machine Technology
Advanced Math
ISBN:
9781337798310
Author:
Peterson, John.
Publisher:
Cengage Learning,
Trigonometry (MindTap Course List)
Trigonometry
ISBN:
9781305652224
Author:
Charles P. McKeague, Mark D. Turner
Publisher:
Cengage Learning
Mathematics For Machine Technology
Advanced Math
ISBN:
9781337798310
Author:
Peterson, John.
Publisher:
Cengage Learning,

Algebra & Trigonometry with Analytic Geometry
Algebra
ISBN:
9781133382119
Author:
Swokowski
Publisher:
Cengage