Which way of dispensing champagne, the traditional vertical method or a tilted beer-like pour, preserves more of the tiny gas bubbles that improve flavor and aroma? The following data was reported in an article. Temp (°C) Type of Pour n Mean (g/L) SD 18 Traditional 4 4.0 0.5 18 Slanted 4 3.7 0.3 12 Traditional 4 3.4 0.4 12 Slanted 4 2.0 0.2 Assume that the sampled distributions are normal. I A USE SALT (a) Carry out a test at significance level 0.01 to decide whether true average Co, loss at 18°C for the traditional pour differs from that for the slanted pour. (Use , for the traditional pour and , for the slanted pour.) State the relevant hypotheses. O Hg: M, - H2 > 0 H,: H - H2 = 0 O Hạ: M - 2 - o Hi M - H2 > 0 O Hg: H - H2 = 0 Hi - H2 <0 O Hg: M - H2 = 0 Hi H - H2 +0 O H: , - H, < 0 HH, - H, = 0 Calculate the test statistic and P-value. (Round your test statistic to one decimal place and your P-value to three decimal places.) P-value- State the conclusion in the problem context. O Reject Hg. The data suggest that the true average Co, loss at 18°C for the traditional pour differs from that for the slanted pour. O Fail to reject H. The data do not suggest that the true average co, loss at 18°C for the traditional pour differs from that for the slanted pour. O Reject Hg. The data do not suggest that the true average Co, loss at 18°C for the traditional pour differs from that for the slanted pour. O Fail to reject H. The data suggest that the true average Co, loss at 18°C for the traditional pour differs from that for the slanted pour. (b) Repeat the test of hypotheses suggested in (a) for the 12° temperature. Is the conclusion different from that for the 18° temperature? Note: The 12° result was reported in the popular media. (Use , for the traditional pour and H, for the slanted pour.) State the relevant hypotheses. O Hg: H - H2 < 0 O Ha: H - H2 - 0 H - H2 > 0
Which way of dispensing champagne, the traditional vertical method or a tilted beer-like pour, preserves more of the tiny gas bubbles that improve flavor and aroma? The following data was reported in an article. Temp (°C) Type of Pour n Mean (g/L) SD 18 Traditional 4 4.0 0.5 18 Slanted 4 3.7 0.3 12 Traditional 4 3.4 0.4 12 Slanted 4 2.0 0.2 Assume that the sampled distributions are normal. I A USE SALT (a) Carry out a test at significance level 0.01 to decide whether true average Co, loss at 18°C for the traditional pour differs from that for the slanted pour. (Use , for the traditional pour and , for the slanted pour.) State the relevant hypotheses. O Hg: M, - H2 > 0 H,: H - H2 = 0 O Hạ: M - 2 - o Hi M - H2 > 0 O Hg: H - H2 = 0 Hi - H2 <0 O Hg: M - H2 = 0 Hi H - H2 +0 O H: , - H, < 0 HH, - H, = 0 Calculate the test statistic and P-value. (Round your test statistic to one decimal place and your P-value to three decimal places.) P-value- State the conclusion in the problem context. O Reject Hg. The data suggest that the true average Co, loss at 18°C for the traditional pour differs from that for the slanted pour. O Fail to reject H. The data do not suggest that the true average co, loss at 18°C for the traditional pour differs from that for the slanted pour. O Reject Hg. The data do not suggest that the true average Co, loss at 18°C for the traditional pour differs from that for the slanted pour. O Fail to reject H. The data suggest that the true average Co, loss at 18°C for the traditional pour differs from that for the slanted pour. (b) Repeat the test of hypotheses suggested in (a) for the 12° temperature. Is the conclusion different from that for the 18° temperature? Note: The 12° result was reported in the popular media. (Use , for the traditional pour and H, for the slanted pour.) State the relevant hypotheses. O Hg: H - H2 < 0 O Ha: H - H2 - 0 H - H2 > 0

Glencoe Algebra 1, Student Edition, 9780079039897, 0079039898, 2018
18th Edition
ISBN:9780079039897
Author:Carter
Publisher:Carter
Chapter10: Statistics
Section10.4: Distributions Of Data
Problem 19PFA

Related questions
Question
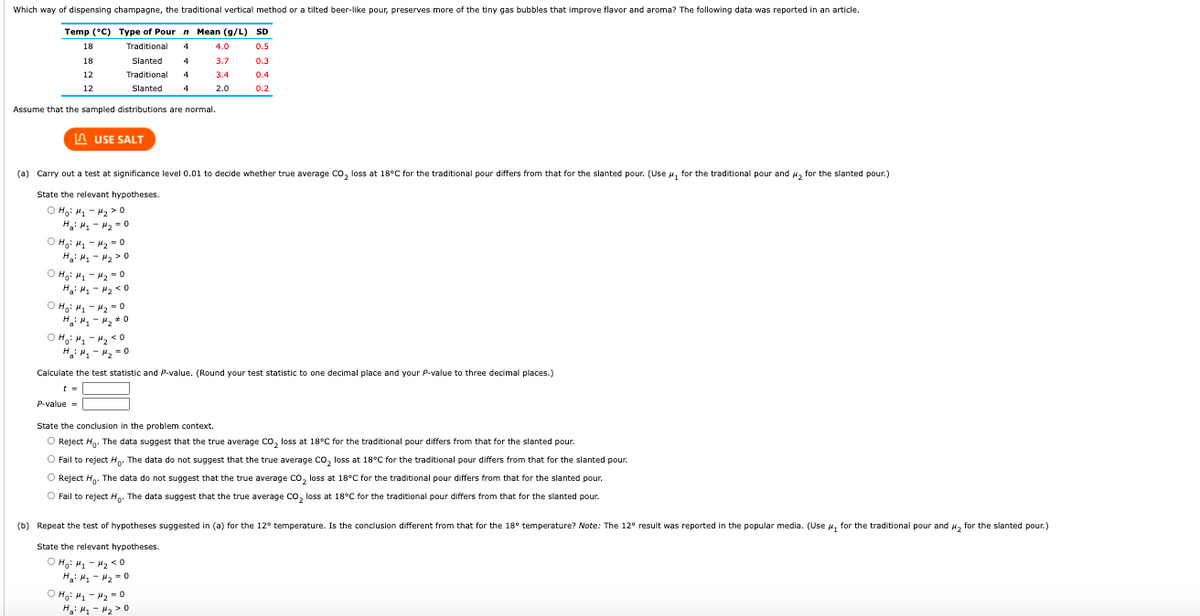
Transcribed Image Text:Which way of dispensing champagne, the traditional vertical method or a tilted beer-like pour, preserves more of the tiny gas bubbles that improve flavor and aroma? The following data was reported in an article.
Temp (°C) TYpe of Pour n Mean (g/L) SD
18
Traditional
4.0
0.5
18
Slanted
4
3.7
0.3
12
Traditional
4
3.4
0.4
12
Slanted
4
2.0
0.2
Assume that the sampled distributions are normal.
A USE SALT
(a) Carry out a test at significance level 0.01 to decide whether true average Co, loss at 18°C for the traditional pour differs from that for the slanted pour. (Use u, for the traditional pour and , for the slanted pour.)
State the relevant hypotheses.
O Ha: H, - H, >0
H H - H2 = o
O Hạ: H, - H2 - o
H: H - H2 > 0
O H: H, - H2 = 0
H: H1 - H2 <0
O Hạ: H - H2 = 0
O H: H, - 4, < o
H - "2 = 0
Calculate the test statistic and P-value. (Round your test statistic to one decimal place and your P-value to three decimal places.)
t =
P-value-
State the conclusion in the problem context.
O Reject H. The data suggest that the true average co, loss at 18°C for the traditional pour differs from that for the slanted pour.
O Fail to reject H. The data do not suggest that the true average Co, loss at 18°C for the traditional pour differs from that for the slanted pour.
O Reject H. The data do not suggest that the true average co, loss at 18°C for the traditional pour differs from that for the slanted pour.
O Fail to reject H. The data suggest that the true average Co, loss at 18°C for the traditional pour differs from that for the slanted pour.
(b) Repeat the test of hypotheses suggested in (a) for the 12° temperature. Is the conclusion different from that for the 18° temperature? Note: The 12° result was reported in the popular media. (Use 4, for the traditional pour and H, for the slanted pour.)
State the relevant hypotheses.
O Hạ: M. - H2 <0
H H - H2 =0
O Hạ: H, - H2 - 0
H: H1 - #2 > 0
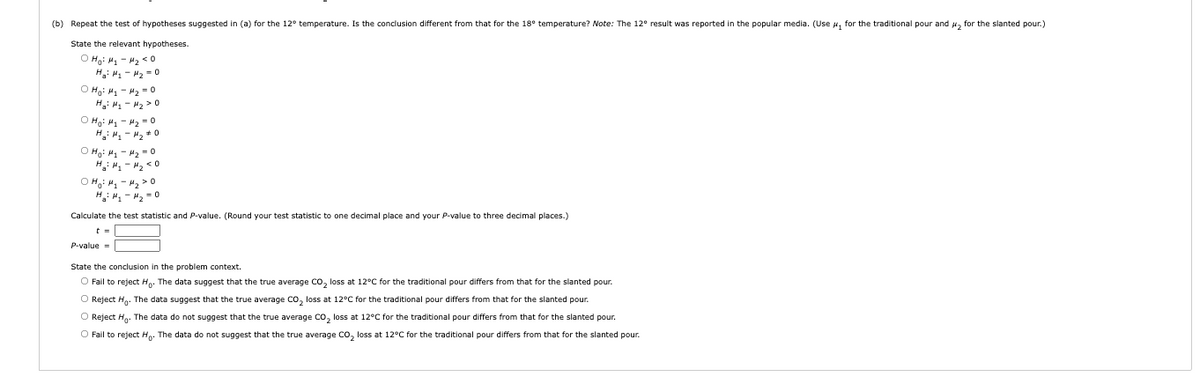
Transcribed Image Text:(b) Repeat the test of hypotheses suggested in (a) for the 12° temperature. Is the conclusion different from that for the 18° temperature? Note: The 12° result was reported in the popular media. (Use u, for the traditional pour and , for the slanted pour.)
State the relevant hypotheses.
O Ha: H - H2 <0
H: H - H2 = o
O Hg: H - H2 -0
H: H, - H2 >0
O Hạ: H - 42 - o
H.: H1 - 2 +0
O Hg: H - 42 = 0
H: " - 2 < 0
O H: H - H2 > 0
H: "- H, = 0
Calculate the test statistic and P-value. (Round your test statistic to one decimal place and your P-value
three decimal places.)
P-value =
State the conclusion in the problem context.
O Fail to reject H. The data suggest that the true average Co, loss at 12°C for the traditional pour differs from that for the slanted pour.
O Reject H. The data suggest that the true average co, loss at 12°C for the traditional pour differs from that for the slanted pour.
O Reject Hg. The data do not suggest that the true average Co, loss at 12°C for the traditional pour differs from that for the slanted pour.
O Fail to reject Hp. The data do not suggest that the true average co, loss at 12°C for the traditional pour differs from that for the slanted pour.
Expert Solution
This question has been solved!
Explore an expertly crafted, step-by-step solution for a thorough understanding of key concepts.

This is a popular solution!

Trending now
This is a popular solution!

Step by step
Solved in 3 steps with 3 images

Recommended textbooks for you
Glencoe Algebra 1, Student Edition, 9780079039897…
Algebra
ISBN:
9780079039897
Author:
Carter
Publisher:
McGraw Hill
Glencoe Algebra 1, Student Edition, 9780079039897…
Algebra
ISBN:
9780079039897
Author:
Carter
Publisher:
McGraw Hill