You want to make an investment in 1 of 3 blue-shares, which are affected by the price of gold. The alternatives are gold, platinum or financial Rand shares. The returns (in R'000) for each investment versus the fluctuations of gold price during 1 year are given in Table 2. Table 2: Investment return (in R'000) Fin. Rand -10 Gold Price Gold Up 16 Unchanged -6 Down 4 Platinum -2 -1 5 30 6 Based on past experience, the following probabilities are assigned to the price of gold: up 0.55, unchanged 0.30 and down 0.15. Before making your final decision, you bought a Financial Main for R20 and studies the economic forecast for the forthcoming year. In the past, if a good economy was forecast, the price of gold went up 80% of the time, down 4% of the time and remained unchanged 16% of the time. a) What would have been your decision in the absence of economic forecast study? b) Determine the optimal action by using Expected Opportunity Loss (EOL) criterion, when the economic forecast study is not considered. c) Conduct a decision analysis determining the best action with probabilities when the economic forecast study is considered. d) Explain if the economic forecast study add a value to the decision?
You want to make an investment in 1 of 3 blue-shares, which are affected by the price of gold. The alternatives are gold, platinum or financial Rand shares. The returns (in R'000) for each investment versus the fluctuations of gold price during 1 year are given in Table 2. Table 2: Investment return (in R'000) Fin. Rand -10 Gold Price Gold Up 16 Unchanged -6 Down 4 Platinum -2 -1 5 30 6 Based on past experience, the following probabilities are assigned to the price of gold: up 0.55, unchanged 0.30 and down 0.15. Before making your final decision, you bought a Financial Main for R20 and studies the economic forecast for the forthcoming year. In the past, if a good economy was forecast, the price of gold went up 80% of the time, down 4% of the time and remained unchanged 16% of the time. a) What would have been your decision in the absence of economic forecast study? b) Determine the optimal action by using Expected Opportunity Loss (EOL) criterion, when the economic forecast study is not considered. c) Conduct a decision analysis determining the best action with probabilities when the economic forecast study is considered. d) Explain if the economic forecast study add a value to the decision?

Practical Management Science
6th Edition
ISBN:9781337406659
Author:WINSTON, Wayne L.
Publisher:WINSTON, Wayne L.
Chapter11: Simulation Models
Section: Chapter Questions
Problem 60P: You are considering a 10-year investment project. At present, the expected cash flow each year is...

Related questions
Question
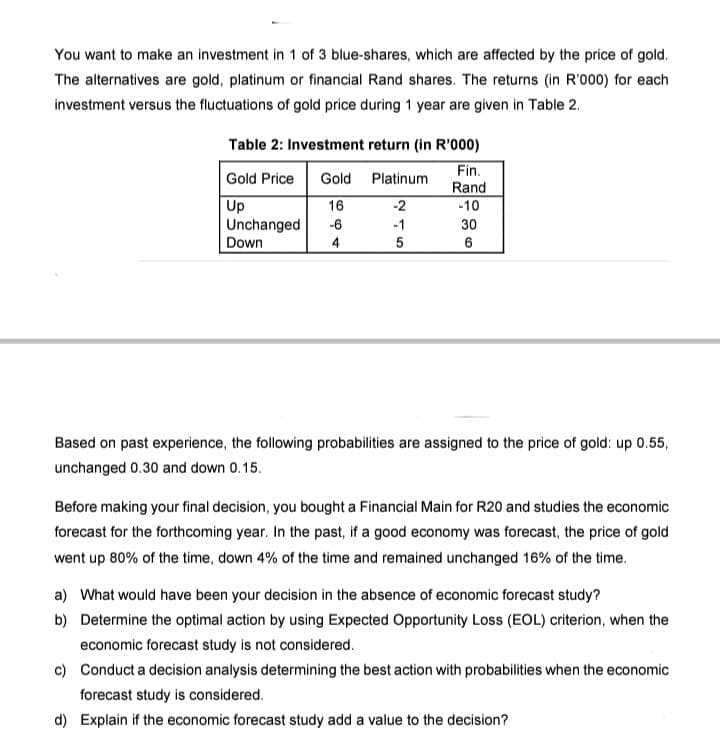
Transcribed Image Text:You want to make an investment in 1 of 3 blue-shares, which are affected by the price of gold.
The alternatives are gold, platinum or financial Rand shares. The returns (in R'000) for each
investment versus the fluctuations of gold price during 1 year are given in Table 2.
Table 2: Investment return (in R'000)
Fin.
Rand
Gold Price Gold
Up
16
Unchanged -6
Down
4
Platinum
-2
-1
5
-10
30
6
Based on past experience, the following probabilities are assigned to the price of gold: up 0.55,
unchanged 0.30 and down 0.15.
Before making your final decision, you bought a Financial Main for R20 and studies the economic
forecast for the forthcoming year. In the past, if a good economy was forecast, the price of gold
went up 80% of the time, down 4% of the time and remained unchanged 16% of the time.
a) What would have been your decision in the absence of economic forecast study?
b) Determine the optimal action by using Expected Opportunity Loss (EOL) criterion, when the
economic forecast study is not considered.
c) Conduct a decision analysis determining the best action with probabilities when the economic
forecast study is considered.
d) Explain if the economic forecast study add a value to the decision?
Expert Solution
This question has been solved!
Explore an expertly crafted, step-by-step solution for a thorough understanding of key concepts.

Step by step
Solved in 5 steps with 6 images

Recommended textbooks for you
Practical Management Science
Operations Management
ISBN:
9781337406659
Author:
WINSTON, Wayne L.
Publisher:
Cengage,
Practical Management Science
Operations Management
ISBN:
9781337406659
Author:
WINSTON, Wayne L.
Publisher:
Cengage,