
Concept explainers
Videos
The stocks in Example 7.9 are all positively correlated. What happens when they are negatively correlated? Answer for each of the following scenarios. In each case, two of the three correlations are the negatives of their original values. Discuss the differences between the optimal portfolios in these three scenarios.
- a. Change the signs of the correlations between stocks 1 and 2 and between stocks 1 and 3. (Here, stock 1 tends to go in a different direction from stocks 2 and 3.)
- b. Change the signs of the correlations between stocks 1 and 2 and between stocks 2 and 3. (Here, stock 2 tends to go in a different direction from stocks 1 and 3.)
- c. Change the signs of the correlations between stocks 1 and 3 and between stocks 2 and 3. (Here, stock 3 tends to go in a different direction from stocks 1 and 2.)
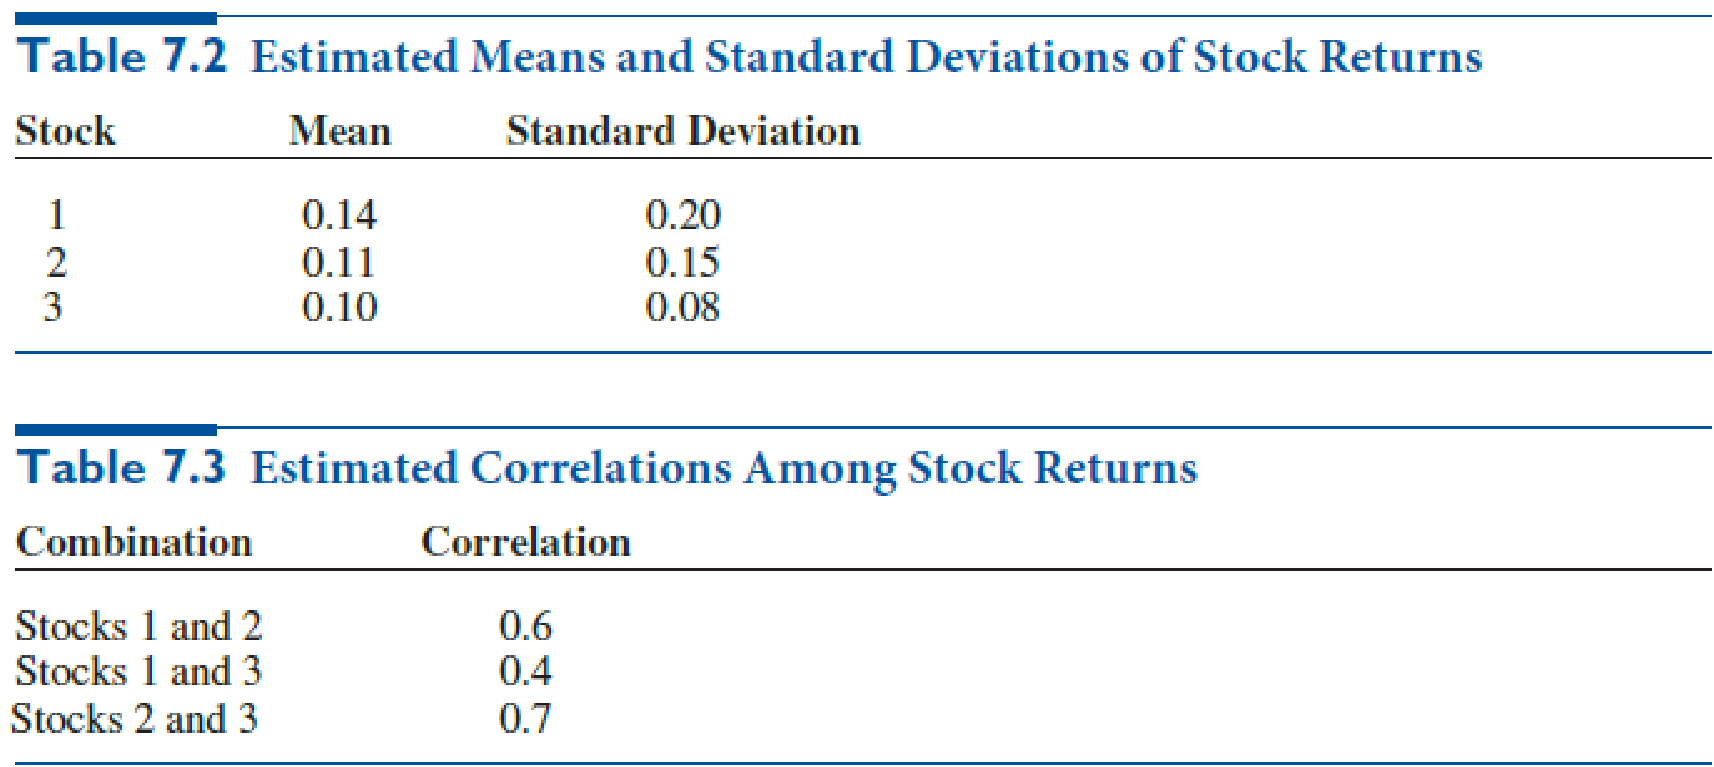
EXAMPLE 7.9 PORTFOLIO SELECTION AT PERLMAN & BROTHERS
Perlman & Brothers, an investment company, intends to invest a given amount of money in three stocks. From past data, the means and standard deviations of annual returns have been estimated as shown in Table 7.2. The correlations among the annual returns on the stocks are listed in Table 7.3. The company wants to find a minimum-variance portfolio that yields a mean annual return of at least 0.12.
Want to see the full answer?
Check out a sample textbook solution
Chapter 7 Solutions
Practical Management Science


- Suppose you currently have a portfolio of three stocks, A, B, and C. You own 500 shares of A, 300 of B, and 1000 of C. The current share prices are 42.76, 81.33, and, 58.22, respectively. You plan to hold this portfolio for at least a year. During the coming year, economists have predicted that the national economy will be awful, stable, or great with probabilities 0.2, 0.5, and 0.3. Given the state of the economy, the returns (one-year percentage changes) of the three stocks are independent and normally distributed. However, the means and standard deviations of these returns depend on the state of the economy, as indicated in the file P11_23.xlsx. a. Use @RISK to simulate the value of the portfolio and the portfolio return in the next year. How likely is it that you will have a negative return? How likely is it that you will have a return of at least 25%? b. Suppose you had a crystal ball where you could predict the state of the economy with certainty. The stock returns would still be uncertain, but you would know whether your means and standard deviations come from row 6, 7, or 8 of the P11_23.xlsx file. If you learn, with certainty, that the economy is going to be great in the next year, run the appropriate simulation to answer the same questions as in part a. Repeat this if you learn that the economy is going to be awful. How do these results compare with those in part a?arrow_forwardSuppose you begin year 1 with 5000. At the beginning of each year, you put half of your money under a mattress and invest the other half in Whitewater stock. During each year, there is a 40% chance that the Whitewater stock will double, and there is a 60% chance that you will lose half of your investment. To illustrate, if the stock doubles during the first year, you will have 3750 under the mattress and 3750 invested in Whitewater during year 2. You want to estimate your annual return over a 30-year period. If you end with F dollars, your annual return is (F/5000)1/30 1. For example, if you end with 100,000, your annual return is 201/30 1 = 0.105, or 10.5%. Run 1000 replications of an appropriate simulation. Based on the results, you can be 95% certain that your annual return will be between which two values?arrow_forwardBased on Grossman and Hart (1983). A salesperson for Fuller Brush has three options: (1) quit, (2) put forth a low level of effort, or (3) put forth a high level of effort. Suppose for simplicity that each salesperson will sell 0, 5000, or 50,000 worth of brushes. The probability of each sales amount depends on the effort level as described in the file P07_71.xlsx. If a salesperson is paid w dollars, he or she regards this as a benefit of w1/2 units. In addition, low effort costs the salesperson 0 benefit units, whereas high effort costs 50 benefit units. If a salesperson were to quit Fuller and work elsewhere, he or she could earn a benefit of 20 units. Fuller wants all salespeople to put forth a high level of effort. The question is how to minimize the cost of encouraging them to do so. The company cannot observe the level of effort put forth by a salesperson, but it can observe the size of his or her sales. Thus, the wage paid to the salesperson is completely determined by the size of the sale. This means that Fuller must determine w0, the wage paid for sales of 0; w5000, the wage paid for sales of 5000; and w50,000, the wage paid for sales of 50,000. These wages must be set so that the salespeople value the expected benefit from high effort more than quitting and more than low effort. Determine how to minimize the expected cost of ensuring that all salespeople put forth high effort. (This problem is an example of agency theory.)arrow_forward
- In Problem 11 from the previous section, we stated that the damage amount is normally distributed. Suppose instead that the damage amount is triangularly distributed with parameters 500, 1500, and 7000. That is, the damage in an accident can be as low as 500 or as high as 7000, the most likely value is 1500, and there is definite skewness to the right. (It turns out, as you can verify in @RISK, that the mean of this distribution is 3000, the same as in Problem 11.) Use @RISK to simulate the amount you pay for damage. Run 5000 iterations. Then answer the following questions. In each case, explain how the indicated event would occur. a. What is the probability that you pay a positive amount but less than 750? b. What is the probability that you pay more than 600? c. What is the probability that you pay exactly 1000 (the deductible)?arrow_forwardA European put option allows an investor to sell a share of stock at the exercise price on the exercise data. For example, if the exercise price is 48, and the stock price is 45 on the exercise date, the investor can sell the stock for 48 and then immediately buy it back (that is, cover his position) for 45, making 3 profit. But if the stock price on the exercise date is greater than the exercise price, the option is worthless at that date. So for a put, the investor is hoping that the price of the stock decreases. Using the same parameters as in Example 11.7, find a fair price for a European put option. (Note: As discussed in the text, an actual put option is usually for 100 shares.)arrow_forwardThe simulation output from Example 11.6 indicates that an investment heavy in stocks produces the best results. Would it be better to invest entirely in stocks? Answer this by rerunning the simulation. Is there any apparent downside to this strategy?arrow_forward
- An investor has a certain amount of money available to invest now. Three alternative investmentsare available. The estimated profit in Kwacha of each investment under each economic conditionare indicated in the following payoff table:Event Investment SelectionA B CEconomy declines 500 -2000 -7000No charge 1000 2000 -1000Economy Expand 2000 5000 20,000Based on his own past experience, the investor assigns the following probabilities to eacheconomic condition:( )( )( )Economy declines 0.30No change 0.50Economy expands 0.20PPP===i. Determine the optimal action based on the maximax criterion ii. Determine the optimal action based on the maximin criterion iii. Compute the expected monetary value (EMV) for each investment iv. Compute the expected opportunity loss (EOL) for each investment v. Explain the meaning of the expected value of perfect information (EVPI) in thisproblem vi. Based on the results of (iii) and (iv), which investment would you choose?vii. Compute the coefficient of…arrow_forwardWe are considering investing in three stocks. The randomvariable Si represents the value one year from now of $1invested in stock i. We are given that E(S1) 1.15, E(S2) 1.21, E(S3) 1.09; var S1 0.09, var S2 0.04, var S3 0.01; cov(S1, S2) 0.006, cov(S1, S3) 0.004, and cov(S2,S3) 0.005. We have $100 to invest and want to have anexpected return of at least 15% during the next year.Formulate a QPP to find the portfolio of minimum variancethat attains an expected return of at least 15%.arrow_forwardDataware is trying to determine whether to give a $10 rebate, cut the price $6, or have no price change on a software product. Currently, 40,000 units of the product are sold each week for $45 apiece. The variable cost of the product is $5. The most likely case appears to be that a $10 rebate will increase sales 30%, and half of all people will claim the rebate. For the price cut, the most likely case is that sales will increase 20%.a. Given all other assumptions, what increase in sales from the rebate would make the rebate and price cut equally desirable?b. Dataware does not really know the increase in sales that will result from a rebate or price cut. However, the company is sure that the rebate will increase sales by between 15% and 40% and that the price cut will increase sales by between 10% and 30%. Perform a sensitivity analysis (two-way data table) that could be used to help determine Dataware’s best decision.arrow_forward
- An investment manager is considering stocks X1, X2, and X3 for investment. Market research shows the following information (per stock) X1 X2 X3 cost $100 risk measure 8 price annual growth rate: 9% annual return: $14 cost $120 risk measure 10 price annual growth rate: 13% annual return: $15 cost $80 risk measure 7 price annual growth rate: 8% annual return: $20 Based on his experience, the manager has set the following priorities for the investment: (1) The total amount invested should be at least $90,000. (d1) (2) The minimum annual average growth rate in stock prices is 12%. (d2) (3) The risk factor of all stocks should not exceed a total of 5,000. (d3) (4) The total annual return should be $15,000. (d4) The constraint for the annual growth rate can be written as: 9X1 + 13X2 + 8X3 ≥ 12 [(9X1 + 13X2 + 8 X3)/(X1+ X2+ X3)] + d2- - d2+ ≥ 12 [(9X1 + 13X2 + 8X3)/(X1+ X2+ X3)] + d2- - d2+ ≤ 0 -3X1+ X2 - 4X3 + d2- - d2+ ≥ 12 -3X1 +…arrow_forwardcan i get help with q3 and q4 Q3. What are the objective coefficient ranges for the four stocks? Show the relevant portion of the Solver’s output. Fully interpret these ranges. Q4. Suppose the investor decides that the annual rate of return no longer has to be at least 9% and agrees to at minimum level of 8%. What does the shadow price associated with this constraint indicate about a possible change in total risk that could occur from this lower rate of return? Show the relevant portion of the Solver’s output. Fully interpret the results.arrow_forwardAn investor is considering investing in stocks, real estate, or bonds economic conditions. Suppose that the probabilities for good, stable and poor conditions are 0.2, 0.4 and … (figure it out), respectively. Table 1 shows the payoff returns for the investor’s decision situation. Table 1: Investment returns Economic Conditions Investment Good Stable Poor Stocks R5 000 R7 000 R3 000 Real estate -R2 000 R10 000 R6 000 Bonds R4 000 R4 000 R4 000 Assuming the probabilities of the occurrence of the state of nature are unknown, what will be the best investment alternative; a) If the decision maker is pessimistic about the future state, (3) b) If the decision maker strikes a compromise between the maximin and maximax, assuming the coefficient of pessimism is 0.2. (4) c) If the decision is based on opportunistic loss. (6) d) If we use the equally likelihood criterionarrow_forward
 Practical Management ScienceOperations ManagementISBN:9781337406659Author:WINSTON, Wayne L.Publisher:Cengage,