You will analyze the Market for Gasoline Step 1: Draw a supply-and-demand diagram. Price is on the vertical axis, quantity is on the horizontal axis, demand is downward-sloping, supply is upward- sloping, and be sure to label equilibrium price and equilibrium quantity. Step 2. Change colors! If you have a highlighter or colored pencil (crayon, sharpie, whatever). Step 3. Show the change in demand or supply (only one curve will shift in each scenario). State if the curve decreases or increases. Step 4: Show the new equilibrium price and equilibrium quantity. Step 5: Repeat Steps 1-4 for each scenario. You will have a total of 4 graphs. • Scenario A: A hurricane destroys refineries that produce gasoline. • Scenario B: Consumers purchase electric vehicles that do not need gasoline. • Scenario C: Technological innovation occurs that reduces the cost of producing gasoline. • Scenario D: Road trips become the one and only vacation option and many families opt for long-distance road trips.
You will analyze the Market for Gasoline Step 1: Draw a supply-and-demand diagram. Price is on the vertical axis, quantity is on the horizontal axis, demand is downward-sloping, supply is upward- sloping, and be sure to label equilibrium price and equilibrium quantity. Step 2. Change colors! If you have a highlighter or colored pencil (crayon, sharpie, whatever). Step 3. Show the change in demand or supply (only one curve will shift in each scenario). State if the curve decreases or increases. Step 4: Show the new equilibrium price and equilibrium quantity. Step 5: Repeat Steps 1-4 for each scenario. You will have a total of 4 graphs. • Scenario A: A hurricane destroys refineries that produce gasoline. • Scenario B: Consumers purchase electric vehicles that do not need gasoline. • Scenario C: Technological innovation occurs that reduces the cost of producing gasoline. • Scenario D: Road trips become the one and only vacation option and many families opt for long-distance road trips.

Managerial Economics: A Problem Solving Approach
5th Edition
ISBN:9781337106665
Author:Luke M. Froeb, Brian T. McCann, Michael R. Ward, Mike Shor
Publisher:Luke M. Froeb, Brian T. McCann, Michael R. Ward, Mike Shor
Chapter8: Understanding Markets And Industry Changes
Section: Chapter Questions
Problem 2MC

Related questions
Question
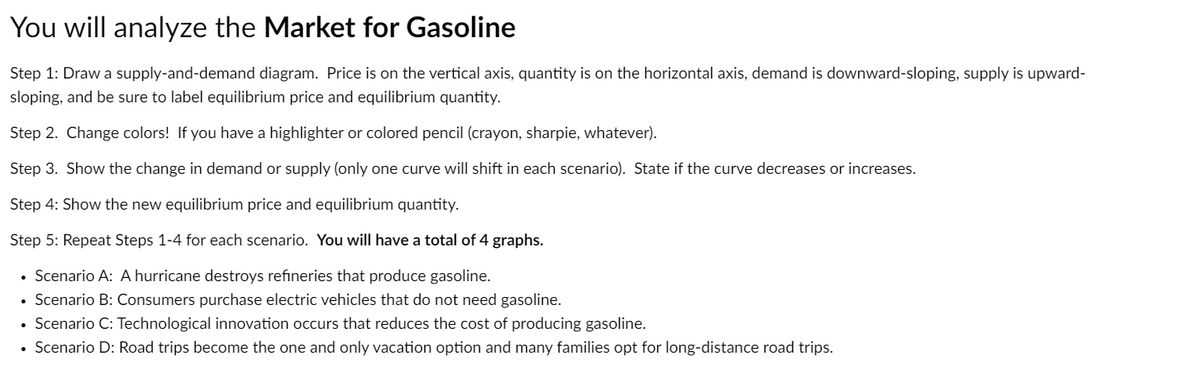
Transcribed Image Text:You will analyze the Market for Gasoline
Step 1: Draw a supply-and-demand diagram. Price is on the vertical axis, quantity is on the horizontal axis, demand is downward-sloping, supply is upward-
sloping, and be sure to label equilibrium price and equilibrium quantity.
Step 2. Change colors! If you have a highlighter or colored pencil (crayon, sharpie, whatever).
Step 3. Show the change in demand or supply (only one curve will shift in each scenario). State if the curve decreases or increases.
Step 4: Show the new equilibrium price and equilibrium quantity.
Step 5: Repeat Steps 1-4 for each scenario. You will have a total of 4 graphs.
Scenario A: A hurricane destroys refineries that produce gasoline.
Scenario B: Consumers purchase electric vehicles that do not need gasoline.
• Scenario C: Technological innovation occurs that reduces the cost of producing gasoline.
Scenario D: Road trips become the one and only vacation option and many families opt for long-distance road trips.
●
.
Expert Solution
This question has been solved!
Explore an expertly crafted, step-by-step solution for a thorough understanding of key concepts.

This is a popular solution!

Trending now
This is a popular solution!

Step by step
Solved in 4 steps with 3 images

Knowledge Booster


Learn more about
Need a deep-dive on the concept behind this application? Look no further. Learn more about this topic, economics and related others by exploring similar questions and additional content below.Recommended textbooks for you
Managerial Economics: A Problem Solving Approach
Economics
ISBN:
9781337106665
Author:
Luke M. Froeb, Brian T. McCann, Michael R. Ward, Mike Shor
Publisher:
Cengage Learning

Exploring Economics
Economics
ISBN:
9781544336329
Author:
Robert L. Sexton
Publisher:
SAGE Publications, Inc

Managerial Economics: A Problem Solving Approach
Economics
ISBN:
9781337106665
Author:
Luke M. Froeb, Brian T. McCann, Michael R. Ward, Mike Shor
Publisher:
Cengage Learning
Exploring Economics
Economics
ISBN:
9781544336329
Author:
Robert L. Sexton
Publisher:
SAGE Publications, Inc

Microeconomics: Principles & Policy
Economics
ISBN:
9781337794992
Author:
William J. Baumol, Alan S. Blinder, John L. Solow
Publisher:
Cengage Learning


Economics (MindTap Course List)
Economics
ISBN:
9781337617383
Author:
Roger A. Arnold
Publisher:
Cengage Learning