
Database System Concepts
7th Edition
ISBN: 9780078022159
Author: Abraham Silberschatz Professor, Henry F. Korth, S. Sudarshan
Publisher: McGraw-Hill Education
expand_more
expand_more
format_list_bulleted
Related questions
Concept explainers
Question
you will learn how to manually classify and cluster data based on a specific variable using R
The dataset that are going to be used in this project is “mtcar” that is available in R studio.
Methodology:
Using the number of cylinders (cyl column) in mtcar dataset(below), classify cars as 4-, 6- or 8-cylinders car. For each class, give a color to the values that belong to that class. Then plot a graph for using “mpg” column as x-axis and “qsec” column as y-axis.
Steps:
- Read the file using R programming language.
- Read values in column “cyl”.
- If x =8, then paint as red, if x =6, then paint as green, If x =4, then paint as blue.
- Plot the values of the columns mpg and qsec into an x&y graph.
- Plot painted values of “cyl” on the same graph.
Finally, you have to add your interpretations of the results. This is very important!
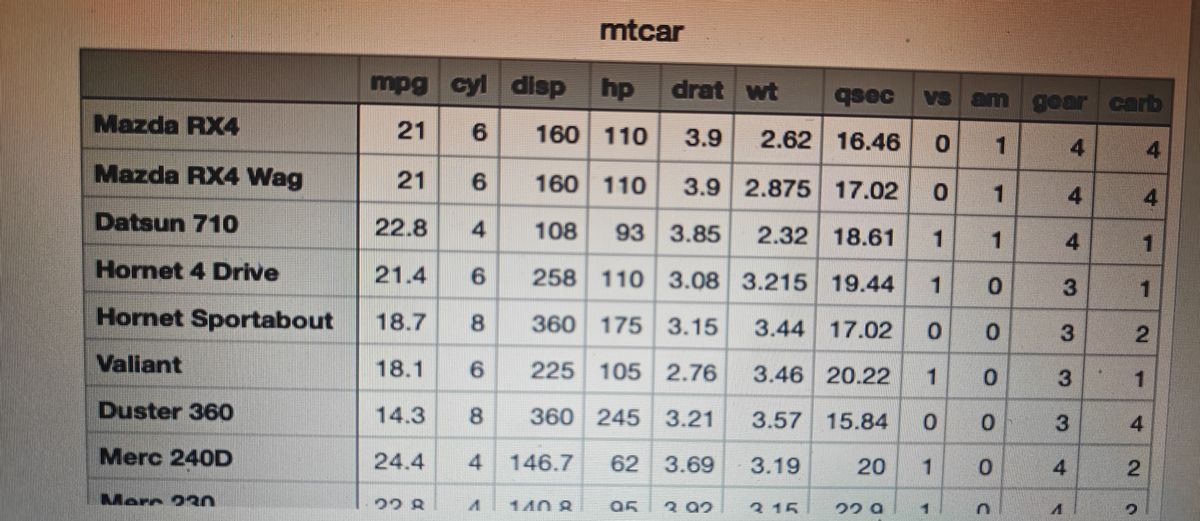

Transcribed Image Text:Mazda RX4
Mazda RX4 Wag
Datsun 710
Hornet 4 Drive
Hornet Sportabout
Valiant
Duster 360
Merc 240D
Marr Dan
Dan
mpg cyl disp hp
21
160 110
21
6
22.8
4
21.4 6
18.7 8
18.1 6
14.3 8
24.4
22 8
mtcar
qsec vs am gear carb
3.9 2.62
16.46 0
1
4
4
160 110 3.9 2.875
17.02 0 1
4
4
108 93 3.85
2.32
18.61 1
1
4
1
258 110 3.08
3.215
19.44 1
0
3
1
360 175 3.15
3.44
17.02 0
0
3
2
225 105 2.76
3.46 20.22 1 0
1
360 245 3.21
3.57 15.84
0
0
4
62 3.69
3.19
1
0
2
4 146.7
140 A
drat wt
20
22 Q
1
n
3
3
4
A
A
Expert Solution
This question has been solved!
Explore an expertly crafted, step-by-step solution for a thorough understanding of key concepts.

Step by stepSolved in 6 steps with 2 images

Knowledge Booster


Learn more about
Need a deep-dive on the concept behind this application? Look no further. Learn more about this topic, computer-science and related others by exploring similar questions and additional content below.Similar questions
- TODO: Lienar Regression with least Mean Squares (LMS) Optimize the model through gradient descent. *Please complete the TODOs. * !pip install wget import osimport randomimport tracebackfrom pdb import set_traceimport sysimport numpy as npfrom abc import ABC, abstractmethodimport traceback from util.timer import Timerfrom util.data import split_data, feature_label_split, Standardizationfrom util.metrics import msefrom datasets.HousingDataset import HousingDataset class BaseModel(ABC): """ Super class for ITCS Machine Learning Class""" @abstractmethod def fit(self, X, y): pass @abstractmethod def predict(self, X): pass class LinearModel(BaseModel): """ Abstract class for a linear model Attributes ========== w ndarray weight vector/matrix """ def __init__(self): """ weight vector w is initialized as None """ self.w = None # check if the matrix is 2-dimensional. if…arrow_forwardTo begin with, why is it necessary to divide the data into training and validation sets? What is the training set going to be utilized for? The function of the validation set is still a mystery.arrow_forwardThis question tests your understanding of data transformation. We did an assignment on this process. If you test your data and find that it is not suitable for testing, which mathematical function can you put each score through to make it usable and suitable for testing? Select one: a. There is no way to make the data usable. b. square root each number c. subtract the df from each number d. use the variance instead of each number Clear my choicearrow_forward
- Use the sacramento.csv file to complete the following assignment. Create a file, sacramento.py, that loads the .csv file and runs a logistic regression. The regression should predict whether or not a house has 1 or more than one bathroom based on beds, sqft, and price, in that order.You will need to create a new variable from baths, and it should make it such that those observations of 1 bath correspond to a value of 0, and those with more than 1 bath correspond to a 1. Make sure to add a constant using sm.add_constant(X) Your file should print the results in this way: print(mod.params.round(2)) print(mod.pvalues.round(2)) print('The smallest p-value is for sqft')arrow_forwardHow could you distinguish a problem with a balance from a user technique issue using the collected statistics?arrow_forwardWe use the Breast Cancer Wisconsin dataset from UCI machine learning repository: http://archive.ics.uci.edu/ml/datasets/Breast+Cancer+Wisconsin+%28Diagnostic%29 Data File: breast-cancer-wisconsin.data (class: 2 for benign, 4 for malignant) Data Metafile: breast-cancer-wisconsin.names Please implement this algorithm for logistic regression (i.e., to minimize the cross-entropy loss as discussed in class), and run it over the Breast Cancer Wisconsin dataset. Please randomly sample 80% of the training instances to train a classifier and then testing it on the remaining 20%. Ten such random data splits should be performed and the average over these 10 trials is used to estimate the generalization performance. You are expected to do the implementation all by yourself so you will gain a better understanding of the method. Please submit: (1) your source code (or Jupyter notebook file) that TA should be able to (compile and) run, and the…arrow_forward
- I already solved I and II, I’m finding it hard matching the images in the question to the ones in my code in III, please check for mistakes and the reason why the code isn’t matching. PS this isn’t an assignment or graded work.arrow_forwardWhen we buy a packaged data model, we receive whatever element we obtain as part of the deal.arrow_forwardPredictive modeling: Task: Ambulance Demand Data Generating Process: for New York City Dates of Coverage {Please identify the specific dates that will be used for this dataset in your modeling effort other than the City Health Department's Emergency Medical Services Division. } Frequency of data collection {how often is the data collected? After every incident? Daily? Yearly?} Agency / Organization collecting the data {who specifically is collecting the data? Please avoid using general references like “government” or “police} Original Unit of Analysis {What is the original unit of analysis for the data as provided? Calls for service? Census tracts? Cities?} Transformed Unit of Analysis{i.e. are you modifying the call data to support your model? Hint: if you are doing “demand” model you will be aggregating the data.} Data Generation Description{here, I want you in your own words to describe how you think the data was generated. Think 2-3 sentences.} Data…arrow_forward
- Provide details on how to use a decision table to generate test cases.arrow_forwardYou are a Data Scientist at United Health. You want to check if a patient will develop cancer based on smoking habits. Please write the R code to generate confusion matrix. Use the following details. After splitting the dataframe, we have test_cancer, and training_cancer. The outcome variable is develop_cancer.arrow_forwardUse the sacramento.csv file to complete the following assignment. Create a file, sacramento.py, that loads the .csv file and runs a logistic regression. The regression should predict whether or not a house has 1 or more than one bathroom based on beds, sqft, and price, in that order.You will need to create a new variable from baths, and it should make it such that those observations of 1 bath correspond to a value of 0, and those with more than 1 bath correspond to a 1. Make sure to add a constant using sm.add_constant(X) Your file should print the results in this way: print(mod.params.round(2)) print(mod.pvalues.round(2)) print('The smallest p-value is for sqft') Please use sm.add_constant(X)! In Jupyter Notebook please! Please use the sys module!arrow_forward
arrow_back_ios
arrow_forward_ios
Recommended textbooks for you
- Database System ConceptsComputer ScienceISBN:9780078022159Author:Abraham Silberschatz Professor, Henry F. Korth, S. SudarshanPublisher:McGraw-Hill Education
 Starting Out with Python (4th Edition)Computer ScienceISBN:9780134444321Author:Tony GaddisPublisher:PEARSON
 Digital Fundamentals (11th Edition)Computer ScienceISBN:9780132737968Author:Thomas L. FloydPublisher:PEARSON
  C How to Program (8th Edition)Computer ScienceISBN:9780133976892Author:Paul J. Deitel, Harvey DeitelPublisher:PEARSON
 Database Systems: Design, Implementation, & Manag...Computer ScienceISBN:9781337627900Author:Carlos Coronel, Steven MorrisPublisher:Cengage Learning
 Programmable Logic ControllersComputer ScienceISBN:9780073373843Author:Frank D. PetruzellaPublisher:McGraw-Hill Education
Database System Concepts
Computer Science
ISBN:9780078022159
Author:Abraham Silberschatz Professor, Henry F. Korth, S. Sudarshan
Publisher:McGraw-Hill Education
Starting Out with Python (4th Edition)
Computer Science
ISBN:9780134444321
Author:Tony Gaddis
Publisher:PEARSON
Digital Fundamentals (11th Edition)
Computer Science
ISBN:9780132737968
Author:Thomas L. Floyd
Publisher:PEARSON
C How to Program (8th Edition)
Computer Science
ISBN:9780133976892
Author:Paul J. Deitel, Harvey Deitel
Publisher:PEARSON
Database Systems: Design, Implementation, & Manag...
Computer Science
ISBN:9781337627900
Author:Carlos Coronel, Steven Morris
Publisher:Cengage Learning
Programmable Logic Controllers
Computer Science
ISBN:9780073373843
Author:Frank D. Petruzella
Publisher:McGraw-Hill Education