
Concept explainers
Videos
Applying the Concepts–Basic
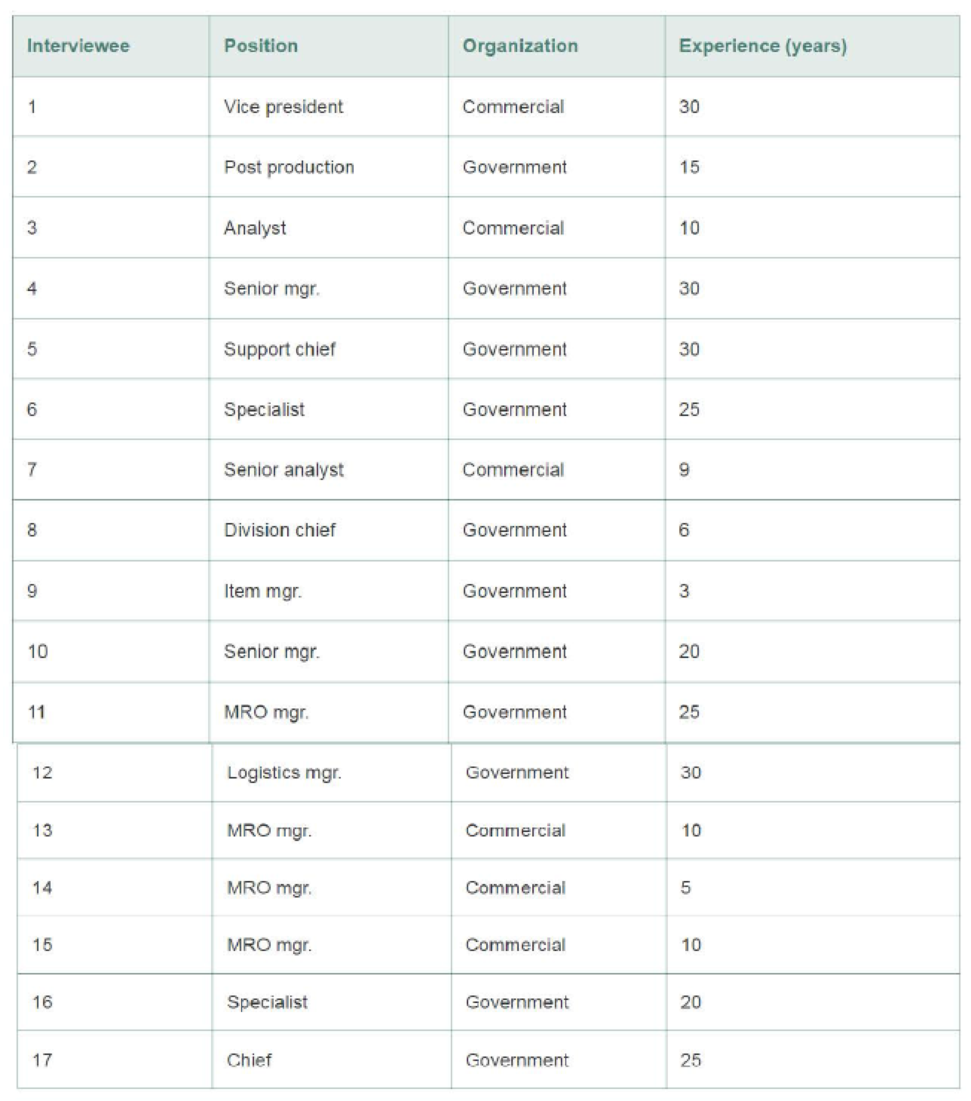
1.15 Performance-based logistics. In industry, performance-based logistics (PBL) strategies are increasingly popular ways to reduce cost, increase revenue, and attain customer satisfaction. The Journal of Business Logistics (Vol. 36, 2015) used the opinions of a sample of 17 upper-level employees of the U.S. Department of Defense and its suppliers to determine the factors that lead to successful PBL projects. The current position (e.g., vice president, manager [mgr.]), type of organization (commercial or government), and years of experience were measured for each employee interviewed. These data are listed below. Identify each variable measured as producing quantitative or qualitative data.
Want to see the full answer?
Check out a sample textbook solution
Chapter 1 Solutions
EP STATISTICS F/BUS.+ECON.-ACCESS 18 WK


- A mail-order catalog business that sells personal computer supplies, software, and hardware maintains a centralized warehouse for the distribution of products ordered. Management is currently examining the process of distribution from the warehouse and has the business objective of determining the factors that affect warehouse distribution costs. Currently, a handling fee is added to the order, regardless of the amount of the order. Data that indicate the warehouse distribution costs and the number of orders received have been collected over the past 24 months and can be seen below: Months Distribution Cost ($thousands) Number of Orders 1 52.95 4015 2 71.66 3806 3 85.58 5309 4 63.69 4262 5 72.81 4296 6 68.44 4097 7 52.46 3213 8 70.77 4809 9 82.03 5237 10 74.39 4732 11 70.84 4413 12 54.08 2921 13 62.98 3977 14 72.30 4428 15 58.99 3964 16 79.38 4582…arrow_forwardA consulting group recently conducted a global survey of product teams with the goal of better understanding the dynamics of product team performance and uncovering the practices that make these teams successful. One of the survey findings was that 33% of organizations have a coherent business strategy that they stick to and effectively communicate. Suppose another study is conducted to check the validity of this result, with the goal of proving that the percentage is less than 33%. Complete parts (a) and (b) below. ..... a. State the null and research hypotheses. Identify the null and alternative hypotheses. О А. Но: п20.33; Н,: п 0.33 С. Но п#0.33;B Н,: п%3D0.33 Ο D. Ho: π = 0.33; ,: π# 0.33 b. A sample of 100 organizations is selected, and results indicate that 32 organizations have a coherent business strategy that they stick to and effectively communicate. Use the p-value approach to determine at the 0.01 level of significance whether there is evidence that the percentage is less…arrow_forwardEach year U.S. News and World Report conducts its "Survey of America's Best Graduate and Professional Schools." and ranks the top 25 business schools, as determined by reputation, student selectivity, placement success, and graduation rate.For each school, three variables were measured: (1) GMAT score for the typical incoming student; (2) student acceptance rate (percentage accepted of all students who applied); and (3) starting salary of the typical graduating student. An academic advisor wants to predict the typical starting salary of a graduate at a top business school using GMAT score of the school as a predictor variable. The results of a simple linear regression of SALARY versus GMAT using the 25 data points are shown below. Is there sufficient evidence to suggest there is a linear relationship between SALARY and GMAT at the 5% level of significance? ----------------------------------------------------------------------------------- a = -92040 b = 228 s = 3213 r2 = .66 r =…arrow_forward
- You are on the board of directors for Sew and Tell, an up and coming apparel brand focusing on producing t-shirts with a positive message. The company is looking to ramp up production and has hired an independent consulting group to evaluate the profitability of either a medium or large scale expansion. Your boss, the company president Jack Pott, has sent you the following email: Board of Directors Member, The consulting group has completed the analysis. The following table breaks down the results with us pursuing either a medium or large scale expansion. It gives low, medium, and high projections, the associated amount of profits (in thousands of $), and the probability of each outcome happening. Medium-Scale Expansion Profit 50 Large-Scale Expansion Profit Probability Probability Low .2 .2 Medium 150 .5 100 .5 High 200 .3 300 .3 Personally, I would love to hit the jackpot and reach a profit of $300,000, but our goal as a company is to maximum profit in the least risky way. Taking…arrow_forwardA consulting group recently conducted a global survey of product teams with the goal of better understanding the dynamics of product team performance and uncovering the practices that make these teams successful. One of the survey findings was that 32% of organizations have a coherent business strategy that they stick to and effectively communicate. Suppose another study is conducted to check the validity of this result, with the goal of proving that the percentage is less than 32%. Complete parts (a) and (b) below. a. State the null and research hypotheses. Identify the null and alternative hypotheses. O A. Ho: as0.32; H,: a>0.32 O B. Ho: 120.32; H: <0.32 OC. Hoi a#0.32; H: =0.32 O D. Ho: 1=0.32; H4: n#0.32 b. A sample of 200 organizations is selected, and results indicate that 58 organizations have a coherent business strategy that they stick to and effectively communicate. Use the p-value approach to determine at the 0.05 level of significance whether there is evidence that the…arrow_forwardA consulting group recently conducted a global survey of product teams with the goal of better understanding the dynamics of product team performance and uncovering the practices that make these teams successful. One of the survey findings was that 37% of organizations have a coherent business strategy that they stick to and effectively communicate. Suppose another study is conducted to check the validity of this result, with the goal of proving that the percentage is less than 37%. Complete parts (a) and (b) below. a. State the null and research hypotheses. Identify the null and alternative hypotheses. O A. H₂: = 0.37; H₁: 0.37 O B. Ho: T#0.37; Hạ: x = 0.37 C. Ho: 20.37; H₁: 0.37 b. A sample of 200 organizations is selected, and results indicate that 68 organizations have a coherent business strategy that they stick to and effectively communicate. Use the p-value approach to determine at the 0.05 level of significance whether there is evidence that the percentage is less than 37%.…arrow_forward
- The manager Concerned about her current customer base, manager Andersen started to think of factors that might affect the attractiveness of an auditing firm. Of course, the service quality provided and the fees charged by the auditor seem two important factors. Next, she decides that the reputation of the auditing firm also needs to be included in the framework as an independent variable. As illustrated by the dramatic effects of recent auditing scandals, reputation seems especially important for large auditors (i.e., auditing firms that are large in size). Finally, manager Andersen also thinks that the proximity of the auditing firm to the customer is another variable to be included as an independent variable. Proximity very likely affects the possibility for the client to personally meet with the auditors on a regular basis and she knows from her own contact with customers that they perceive personal interactions as quite important. Consider the above scenario shown; answer the…arrow_forwardSocial media provides an enormous amount of data about the activities and habits of people using social platforms like Face book and Twitter. The belief is that mining that data provides a treasure trove for those who seek to quantify and predict future human behavior. A marketer is planning a survey of Internet users in the United States to determine social media usage. The objective of the survey is to gain insight on these three items: key social media platforms used, frequency of social media usage, and demographics of key social media platform users. a. For each of the three items listed, indicate whether the variables are categorical or numerical. If a variable is numerical, is it dis crete or continuous? b. Develop five categorical questions for the survey. c. Develop five numerical questions for the survey.arrow_forwardThe more costly and time-consuming it is to export and import, the more difficult it is for local companies to be competitive and to reach international markets. As part of an initial investigation exploring foreign market entry, 9 countries were selected from each of four global regions. The cost associated with importing a standardized cargo of goods by sea transport in these countries (in US$ per container) is stored in the accompanying data table. Complete parts (a) through (d). East Asia & Pacific Eastern Europe & Central Asia Latin America & Caribbean Middle East & North Africa240 77 1200 466777 335 688 397266 396 970 554383 83 290 644580 150 545 181220 306 420 646389 1125 450 695233 655 583 754392 100 1500 779 c. At the 0.05 level of significance, is there evidence of a difference in the variation in cost of importing among the four global regions? Determine…arrow_forward
- Identify several types of manufacturing companies for which process costing would be an appropriate product-costing system. What characteristics do the products of these companies have that would make process costing a good choice? How is process costing similar and different in a second or later processing department?arrow_forwardPursuing an MBA is a major personal investment. Tuition and expenses associated with business school programs are costly, but the high costs come with hopes of career advancement and high salaries. A prospective MBA student would like to examine the factors that impact starting salary upon graduation and decides to develop a model that uses program per-year tuition as a predictor of starting salary. Data were collected for 37 full-time MBA programs offered at private universities. The data are stored in the accompanying table. Complete parts (a) through (e) below. E Click the icon to view the data on program per-year tuition and mean starting salary. a. Construct a scatter plot. Choose the correct graph below. O A. OB. Oc. OD. 80,000- 200,000- 80,000- 200,000- 0- 0- 200,000 Starting Salary (S) 80,000 Tuilion ($) 200,000 Starting Salary (S) 80,000 Tuilion (S) b. Assuming a linear relationship, use the least-squares method to determine the regression coefficients b, and b,. bo =0 b, =0…arrow_forwardPursuing an MBA is a major personal investment. Tuition and expenses associated with business school programs are costly, but the high costs come with hopes of career advancement and high salaries. A prospective MBA student would like to examine the factors that impact starting salary upon graduation and decides to develop a model that uses program per-year tuition as a predictor of starting salary. Data were collected for 37 full-time MBA programs offered at private universities. The data are stored in the accompanying table. Complete parts (a) through (e) below. Click the icon to view the data on program per year tution and mean starting salary a. Construct a scatter plot. Choose the correct graph below. 200,000- OB 200,000- 0- OC. 80,000 ○ D. 80,000- 80,000 200,000 200,000 Starting Salary ($) Starting Salary ($) 80,000 Tuition ($) b. Assuming a linear relationship, use the least-squares method to determine the regression coefficients by and by Tuition ($) by= (Round the value of by…arrow_forward
 Big Ideas Math A Bridge To Success Algebra 1: Stu...AlgebraISBN:9781680331141Author:HOUGHTON MIFFLIN HARCOURTPublisher:Houghton Mifflin Harcourt