
Videos
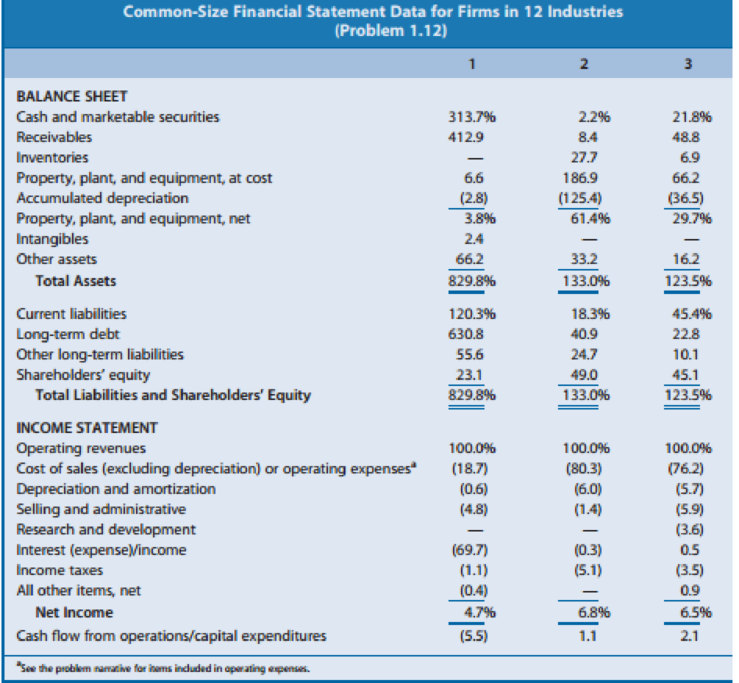
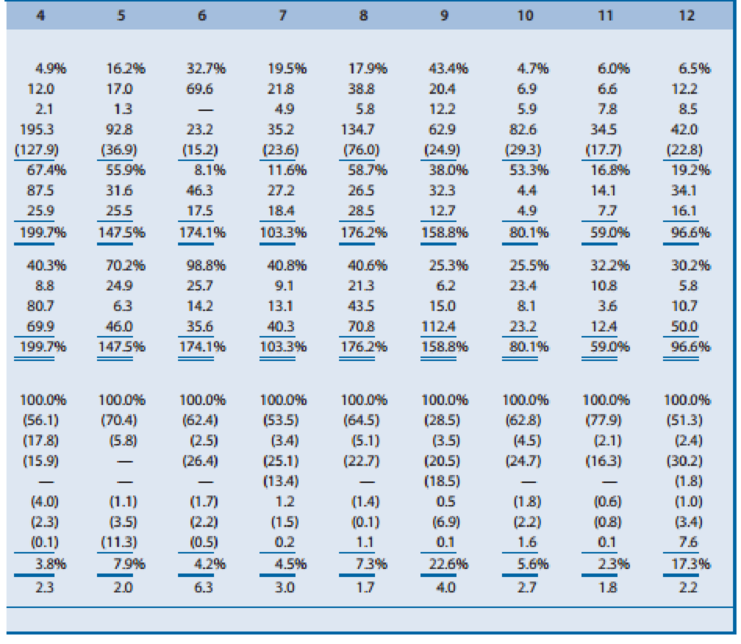
Effect of Industry Characteristics on Financial Statement Relations: A Global Perspective. Effective financial statement analysis requires an understanding of a firm’s economic characteristics. The relations between various financial statement items provide evidence of many of these economic characteristics. Exhibit 1.24 (pages 66–67) presents common-size condensed balance sheets and income statements for 12 firms in different industries. These common-size balance sheets and income statements express various items as a percentage of operating revenues. (That is, the statement divides all amounts by operating revenues for the year.) A dash for a particular financial statement item does not necessarily mean the amount is zero. It merely indicates that the amount is not sufficiently large for the firm to disclose it. A list of the 12 companies, the country of their headquarters, and a brief description of their activities follow.
- A. Accor (France): World’s largest hotel group, operating hotels under the names of Sofitel, Novotel, Motel 6, and others. Accor has grown in recent years by acquiring established hotel chains.
- B. Carrefour (France): Operates grocery supermarkets and hypermarkets in Europe, Latin America, and Asia.
- C. Deutsche Telekom (Germany): Europe’s largest provider of wired and wireless telecommunication services. The telecommunications industry has experienced increased deregulation in recent years.
- D. E.ON AG (Germany): One of the major public utility companies in Europe and the world’s largest privately owned energy service provider.
- E. Fortis (Netherlands): Offers insurance and banking services. Operating revenues include insurance premiums received, investment income, and interest revenue on loans. Operating expenses include amounts actually paid or amounts it expects to pay in the future on insurance coverage outstanding during the year.
- F. Interpublic Group (U.S.): Creates advertising copy for clients. Interpublic purchases advertising time and space from various media and sells it to clients. Operating revenues represent the commissions or fees earned for creating advertising copy and selling media time and space. Operating expenses include employee compensation.
- G. Marks & Spencer (U.K.): Operates department stores in England and other retail stores in Europe and the United States. Offers its own credit card for customers’ purchases.
- H. Nestlé (Switzerland): World’s largest food processor, offering prepared foods, coffees, milk-based products, and mineral waters.
- I. Roche Holding (Switzerland): Creates, manufactures, and distributes a wide variety of prescription drugs.
- J. Sumitomo Metal (Japan): Manufacturer and seller of steel sheets and plates and other construction materials.
- K. Sun Microsystems (U.S.): Designs, manufactures, and sells workstations and servers used to maintain integrated computer networks. Sun outsources the manufacture of many of its computer components.
- L. Toyota Motor (Japan): Manufactures automobiles and offers financing services to its customers.
REQUIRED
Use the ratios to match the companies in Exhibit 1.24 with the firms listed above.

Trending nowThis is a popular solution!

Chapter 1 Solutions
Financial Reporting, Financial Statement Analysis and Valuation


- Effect of Industry Characteristics on Financial Statement Relations. Effective financial statement analysis requires an understanding of a firms economic characteristics. The relations between various financial statement items provide evidence of many of these economic characteristics. Exhibit 1.22 (pages 6061) presents common-size condensed balance sheets and income statements for 12 firms in different industries. These common-size balance sheets and income statements express various items as a percentage of operating revenues. (That is, the statement divides all amounts by operating revenues for the year.) Exhibit 1.22 also shows the ratio of cash flow from operations to capital expenditures. A dash for a particular financial statement item does not necessarily mean the amount is zero. It merely indicates that the amount is not sufficiently large enough for the firm to disclose it. Amounts that are not meaningful are shown as n.m. A list of the 12 companies and a brief description of their activities follow. A. Amazon.com: Operates websites to sell a wide variety of products online. The firm operated at a net loss in all years prior to that reported in Exhibit 1.22. B. Carnival Corporation: Owns and operates cruise ships. C. Cisco Systems: Manufactures and sells computer networking and communications products. D. Citigroup: Offers a wide range of financial services in the commercial banking, insurance, and securities business. Operating expenses represent the compensation of employees. E. eBay: Operates an online trading platform for buyers to purchase and sellers to sell a variety of goods. The firm has grown in part by acquiring other companies to enhance or support its online trading platform. F. Goldman Sachs: Offers brokerage and investment banking services. Operating expenses represent the compensation of employees. G. Johnson Johnson: Develops, manufactures, and sells pharmaceutical products, medical equipment, and branded over-the-counter consumer personal care products. H. Kelloggs: Manufactures and distributes cereal and other food products. The firm acquired other branded food companies in recent years. I. MGM Mirage: Owns and operates hotels, casinos, and golf courses. J. Molson Coors: Manufactures and distributes beer. Molson Coors has made minority ownership investments in other beer manufacturers in recent years. K. Verizon: Maintains a telecommunications network and offers telecommunications services. Operating expenses represent the compensation of employees. Verizon has made minority investments in other cellular and wireless providers. L. Yum! Brands: Operates chains of name-brand restaurants, including Taco Bell, KFC, and Pizza Hut. REQUIRED Use the ratios to match the companies in Exhibit 1.22 with the firms listed above.arrow_forwardEffect of Industry Characteristics on Financial Statement Relations. Effective financial statement analysis requires an understanding of a firms economic characteristics. The relations between various financial statement items provide evidence of many of these economic characteristics. Exhibit 1.23 (pages 6263) presents common-size condensed balance sheets and income statements for 12 firms in different industries. These common-size balance sheets and income statements express various items as a percentage of operating revenues. (That is, the statement divides all amounts by operating revenues for the year.) Exhibit 1.23 also shows the ratio of cash flow from operations to capital expenditures. A dash for a particular financial statement item does not necessarily mean the amount is zero. It merely indicates that the amount is not sufficiently large for the firm to disclose it. A list of the 12 companies and a brief description of their activities follow. A. Abercrombie Fitch: Sells retail apparel primarily through stores to the fashionconscious young adult and has established itself as a trendy, popular player in the specialty retailing apparel industry. B. Allstate Insurance: Sells property and casualty insurance, primarily on buildings and automobiles. Operating revenues include insurance premiums from customers and revenues earned from investments made with cash received from customers before Allstate pays customers claims. Operating expenses include amounts actually paid or expected to be paid in the future on insurance coverage outstanding during the year. C. Best Buy: Operates a chain of retail stores selling consumer electronic and entertainment equipment at competitively low prices. D. E. I. du Pont de Nemours: Manufactures chemical and electronics products. E. Hewlett-Packard: Develops, manufactures, and sells computer hardware. The firm outsources manufacturing of many of its computer components. F. HSBC Finance: Lends money to consumers for periods ranging from several months to several years. Operating expenses include provisions for estimated uncollectible loans (bad debts expense). G. Kelly Services: Provides temporary office services to businesses and other firms. Operating revenues represent amounts billed to customers for temporary help services, and operating expenses include amounts paid to the temporary help employees of Kelly. H. McDonalds: Operates fast-food restaurants worldwide. A large percentage of McDonalds restaurants are owned and operated by franchisees. McDonalds frequently owns the restaurant buildings of franchisees and leases them to franchisees under long-term leases. I. Merck: A leading research-driven pharmaceutical products and services company. Merck discovers, develops, manufactures, and markets a broad range of products to improve human and animal health directly and through its joint ventures. J. Omnicom Group: Creates advertising copy for clients and is the largest marketing services firm in the world. Omnicom purchases advertising time and space from various media and sells it to clients. Operating revenues represent commissions and fees earned by creating advertising copy and selling media time and space. Operating expenses includes employee compensation. K. Pacific Gas Electric: Generates and sells power to customers in the western United States. L. Procter Gamble: Manufactures and markets a broad line of branded consumer products. REQUIRED Use the ratios to match the companies in Exhibit 1.23 with the firms listed above.arrow_forwardWhich of the following types of analysis compares one corporation to another corpora ion and to industry averages? a. timetable analysis c. company analysis b. time series analysis d. cross sectional analysisarrow_forward
- Value Chain Analysis and Financial Statement Relations. Exhibit 1.25 (page 68) presents common-size income statements and balance sheets for seven firms that operate at various stages in the value chain for the pharmaceutical industry. These common-size statements express all amounts as a percentage of sales revenue. Exhibit 1.25 also shows the cash flow from operations to capital expenditures ratios for each firm. A dash for a particular financial statement item does not necessarily mean the amount is zero. It merely indicates that the amount is not sufficiently large for the firm to disclose it. A list of the seven companies and a brief description of their activities follow. A. Wyeth: Engages in the development, manufacture, and sale of ethical drugs (that is, drugs requiring a prescription). Wyeths drugs represent primarily mixtures of chemical compounds. Ethical-drug companies must obtain approval of new drugs from the U.S. Food and Drug Administration (FDA). Patents protect such drugs from competition until other drug companies develop more effective substitutes or the patent expires. B. Amgen: Engages in the development, manufacture, and sale of drugs based on biotechnology research. Biotechnology drugs must obtain approval from the FDA and enjoy patent protection similar to that for chemical-based drugs. The biotechnology segment is less mature than the ethical-drug industry, with relatively few products having received FDA approval. C. Mylan Laboratories: Engages in the development, manufacture, and sale of generic drugs. Generic drugs have the same chemical compositions as drugs that had previously benefited from patent protection but for which the patent has expired. Generic-drug companies have benefited in recent years from the patent expiration of several major ethical drugs. However, the major ethical-drug companies have increasingly offered generic versions of their ethical drugs to compete against the generic-drug companies. D. Johnson Johnson: Engages in the development, manufacture, and sale of over-thecounter health care products. Such products do not require a prescription and often benefit from brand recognition. E. Covance: Offers product development and laboratory testing services for biotechnology and pharmaceutical drugs. It also offers commercialization services and market access services. Cost of goods sold for this company represents the salaries of personnel conducting the laboratory testing and drug approval services. F. Cardinal Health: Distributes drugs as a wholesaler to drugstores, hospitals, and mass erchandisers. Also offers pharmaceutical benefit management services in which it provides customized databases designed to help customers order more efficiently, contain costs, and monitor their purchases. Cost of goods sold for Cardinal Health includes the cost of drugs sold plus the salaries of personnel providing pharmaceutical benefit management services. G. Walgreens: Operates a chain of drugstores nationwide. The data in Exhibit 1.25 for Walgreens include the recognition of operating lease commitments for retail space. REQUIRED Use the ratios to match the companies in Exhibit 1.25 with the firms listed above.arrow_forwardAnalyze and compare Bank of America and Wells Fargo Bank of America Corporation (BAC) and Wells Fargo Company (WFC) are two large financial services companies. The following data (in millions) were taken from a recent years financial statements for both companies: a. Compute the earnings per share for both companies. Round to the nearest cent. a. Which company appears to be more profitable on an earnings-per-share basis? b. Which company would you expect to have the larger quoted market price?arrow_forwardCarson Electronics’ management has long viewed BGT Electronics as an industry leader and uses this firm as a model firm for analyzing its own performance. The balance sheet and income statements for the two firms are as follows: Calculate the following ratios for both Carson and BGT: a) Debt ratio: b) Average collection period: c) Fixed asset turnover: d) Return on equity:arrow_forward
- What is the difference between a horizontal analysis of an Income Statement and Balance Sheet and a vertical analysis of an Income Statement and Balance Sheet? What are the pros and cons of each? What are some of the strengths, weaknesses or developing problems one can identify from a horizontal analysis of an Income Statement and Balance Sheet of a company over the last two years? What are some of the strengths, weaknesses or developing problems one can identify from a vertical analysis of an Income Statement and Balance Sheet of a company over the last two years?arrow_forwardHow to Analyse and interpret the financial performance of a company using at least three ratios and a description of the key performance areas (KPAs) from both a management and shareholder perspectivearrow_forwardWhich of the following best describes horizontal analysis? A comparing a company's financial statements with other companies B calculating key ratios to evaluate performance C comparing financial statement amounts from year to year for the same company D expressing each financial statement amount as a percentage of a budgeted amountarrow_forward
- Explain the usefulness of ratio analysis when making performance comparisons between multinational corporations operating in different countries.arrow_forwardYou are tasked with performing a detailed financial analysis of two Jamaican companies: Honey Bun Ltd and Consolidated Bakeries Ltd. More specifically, you are to prepare a single comprehensive report which addresses the following requirements: 8. You are also to prepare a summary comparing and contrasting the general liquidity, solvency, profitability, asset management, and investment performance of BOTH companies. The comparative discussion for each ratio category should span one to two welldeveloped paragraphs. ▪ You are to use the Jamaica Stock Exchange website or the respective company websites to retrieve the annual reports for the companies for 2020 and 2021, as these reports contain the financial statements and other background information which will form the basis of your analysis. You will also be expected to pull on other research sources to support your analysis and to meet the requirements of the task.arrow_forwardperformance of National Company. Comment on overall financial position and financial health of the business. Identify problems and recommend possible solutions, if historical ratios of company are: Ratios201720182019 Current Ratio1.41.51.6 Acid Test Ratio0.850.740.63 Asset Turnover Ratio4 times3.22.5 Inventory Turnover Ratio6 times5.55 Collection Period6 times5.55 Account payable turnover8 times10 times12 times Total Debt to equity Ratio1.381.611.91 Interest cover543.5 Gross Profit Ratio20%22%23% Net Profit Margin8.5%6.7%3.8% Return on Equity20%21%24% Sales Growth Rate8%5%2% P/E Ratio1098 Fixed Asset Utilization Ratio21.71.4arrow_forward
 Financial Reporting, Financial Statement Analysis...FinanceISBN:9781285190907Author:James M. Wahlen, Stephen P. Baginski, Mark BradshawPublisher:Cengage Learning
 Financial And Managerial AccountingAccountingISBN:9781337902663Author:WARREN, Carl S.Publisher:Cengage Learning,
 Cornerstones of Financial AccountingAccountingISBN:9781337690881Author:Jay Rich, Jeff JonesPublisher:Cengage Learning
 Intermediate Financial Management (MindTap Course...FinanceISBN:9781337395083Author:Eugene F. Brigham, Phillip R. DavesPublisher:Cengage Learning