Bundle: Modern Business Statistics With Microsoft Excel, 5th + Cengagenow, 2 Term (12 Months) Printed Access Card
5th Edition
ISBN: 9781305135406
Author: David R. Anderson, Dennis J. Sweeney, Thomas A. Williams
Publisher: Cengage Learning
expand_more
expand_more
format_list_bulleted
Concept explainers
Videos
Textbook Question
Chapter 1, Problem 15SE
Every year, the U.S. Coast Guard collects data and compiles statistics on reported recreational boating accidents. These statistics are derived from accident reports that are filed by the owners/operators of recreational vessels involved in accidents. In 2009, 4730 recreational boating accident reports were filed. Figure 1.12 provides a bar chart summarizing the number of accident reports that were filed each month (U.S. Coast Guard’s Boating Safety Division website, August 2010).
- a. Are the data categorical or quantitative?
- b. Are the data time series or cross-sectional?
FIGURE 1.12 Number of recreational boating accidents
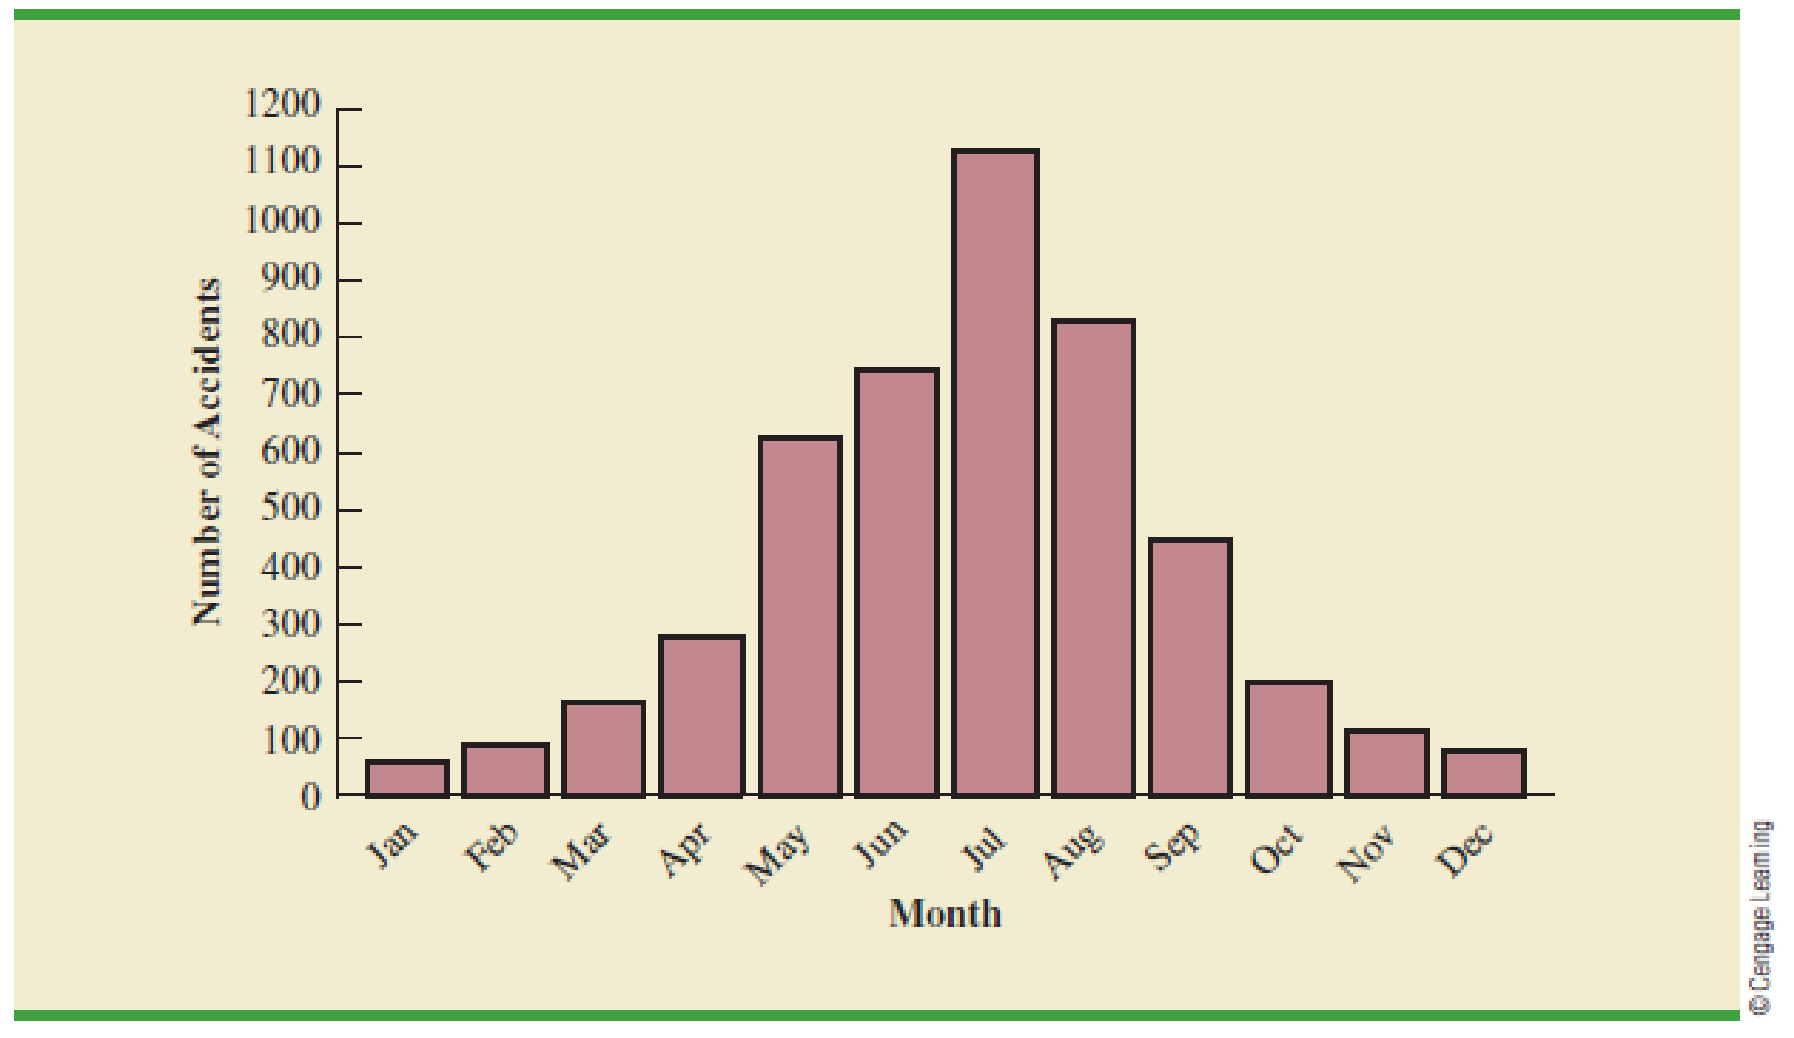
- c. In what month were the most accident reports filed? Approximately how many?
- d. There were 61 accident reports filed in January and 76 accident reports filed in December. What percentage of the total number of accident reports for the year was filed in these two months? Does this seem reasonable?
- e. Comment on the overall shape of the bar graph.
Expert Solution & Answer
Want to see the full answer?
Check out a sample textbook solution
Chapter 1 Solutions
Bundle: Modern Business Statistics With Microsoft Excel, 5th + Cengagenow, 2 Term (12 Months) Printed Access Card
Ch. 1 - 1. Discuss the differences between statistics as...Ch. 1 - 2. Tablet PC Comparison provides a wide variety of...Ch. 1 - 3. Refer to Table 1.6.
What is the average cost...Ch. 1 - 4. Table 1.7 shows data for eight cordless...Ch. 1 - 5. Refer to the data set in Table 1.7.
What is the...Ch. 1 - 6. J.D. Power and Associates surveys new...Ch. 1 - 7. The Kroger Company is one of the largest...Ch. 1 - 8. The Tennessean, an online newspaper located in...Ch. 1 - 9. The Commerce Department reported receiving the...Ch. 1 - 10. The Bureau of Transportation Statistics...
Ch. 1 - 11. In a Gallup telephone survey conducted on...Ch. 1 - 12. The Hawaii Visitors Bureau collects data on...Ch. 1 - Prob. 13SECh. 1 - Prob. 14SECh. 1 - Every year, the U.S. Coast Guard collects data and...Ch. 1 - 17. A manager of a large corporation recommends a...Ch. 1 - 18. A random telephone survey of 1021 adults (aged...Ch. 1 - 19. A Bloomberg Businessweek North American...Ch. 1 - 20. A survey of 131 investment managers in...Ch. 1 - 21. A seven-year medical research study reported...Ch. 1 - Prob. 22SECh. 1 - Prob. 23SECh. 1 - 24. A sample of midterm grades for five students...Ch. 1 -
Table 1.8 shows a data set containing information...
Knowledge Booster


Learn more about
Need a deep-dive on the concept behind this application? Look no further. Learn more about this topic, statistics and related others by exploring similar questions and additional content below.Recommended textbooks for you
 Functions and Change: A Modeling Approach to Coll...AlgebraISBN:9781337111348Author:Bruce Crauder, Benny Evans, Alan NoellPublisher:Cengage Learning
Functions and Change: A Modeling Approach to Coll...
Algebra
ISBN:9781337111348
Author:Bruce Crauder, Benny Evans, Alan Noell
Publisher:Cengage Learning
The Shape of Data: Distributions: Crash Course Statistics #7; Author: CrashCourse;https://www.youtube.com/watch?v=bPFNxD3Yg6U;License: Standard YouTube License, CC-BY
Shape, Center, and Spread - Module 20.2 (Part 1); Author: Mrmathblog;https://www.youtube.com/watch?v=COaid7O_Gag;License: Standard YouTube License, CC-BY
Shape, Center and Spread; Author: Emily Murdock;https://www.youtube.com/watch?v=_YyW0DSCzpM;License: Standard Youtube License