
Essentials Of Statistics For Business & Economics
9th Edition
ISBN: 9780357045435
Author: David R. Anderson, Dennis J. Sweeney, Thomas A. Williams, Jeffrey D. Camm, James J. Cochran
Publisher: South-Western College Pub
expand_more
expand_more
format_list_bulleted
Videos
Textbook Question
thumb_up100%
Chapter 1, Problem 16SE
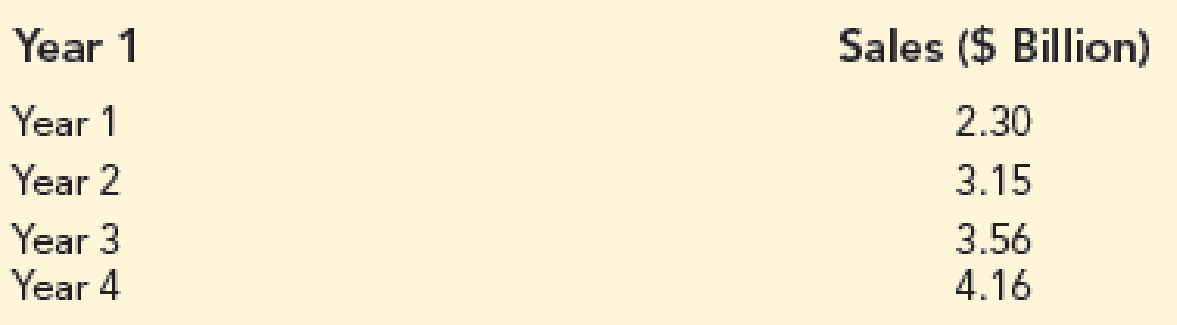
Athletic Shoe Sales. Skechers U.S.A., Inc., is a performance footwear company headquartered in Manhattan Beach, California. The sales revenue for Skechers over a four-year period are as follows:
- a. Are these cross-sectional or time-series data?
FIGURE 1.9 Estimated Monthly Jewelry Sales in the United States for 2016
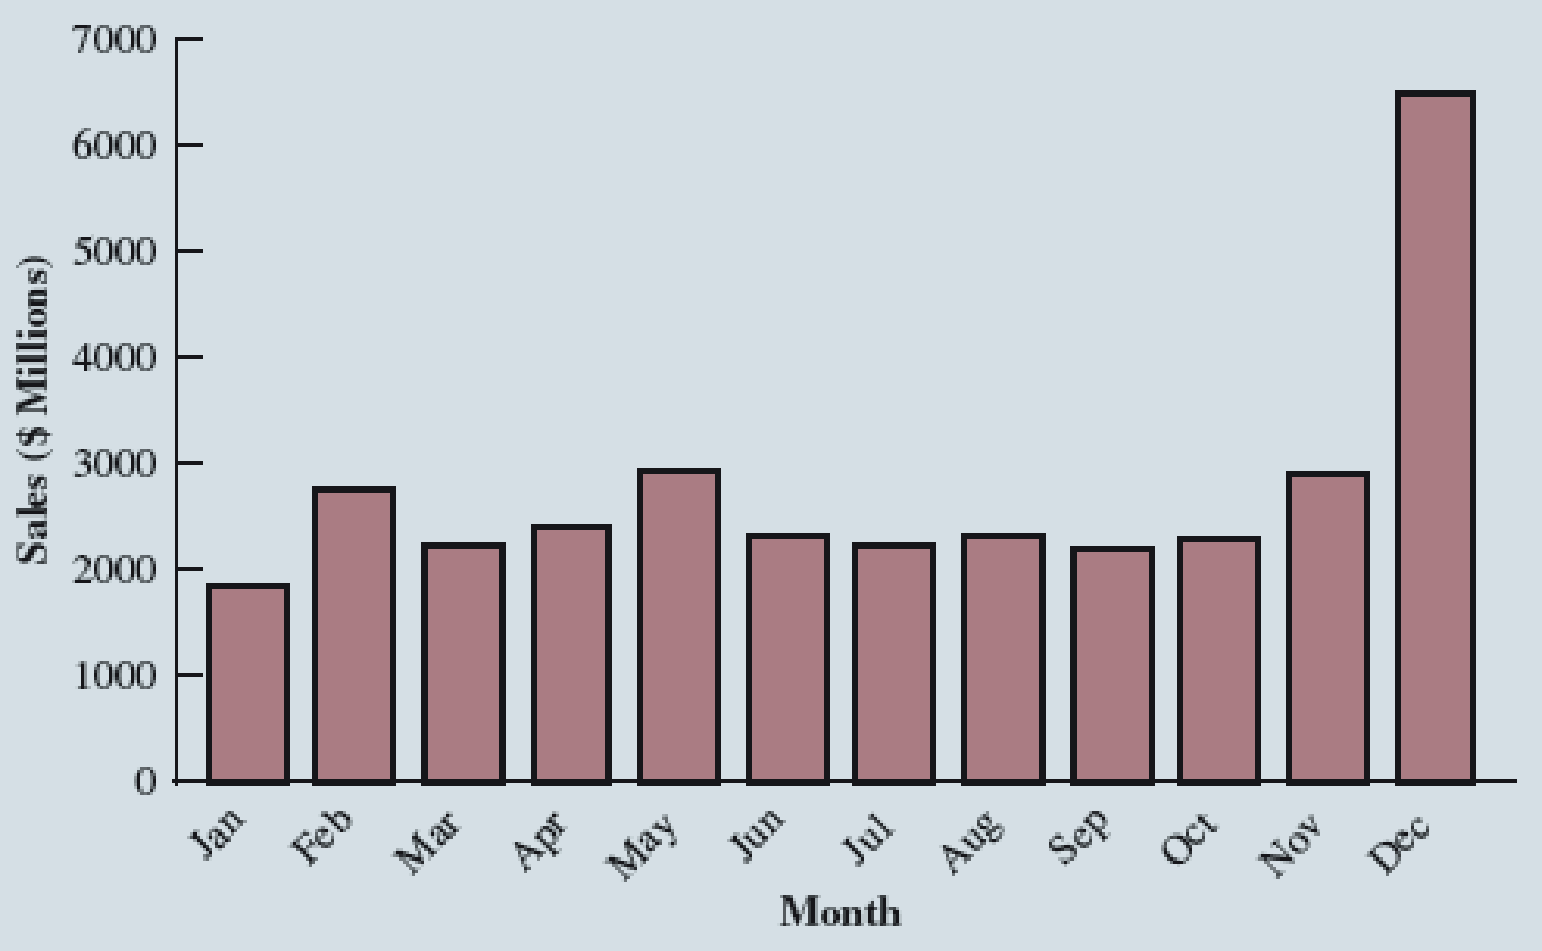
Source: The U.S. Census Bureau tracks sales per month for various products and services through its Monthly Retail Trade Survey (https://www.census.gov/retail/mrts/historic_releases.html)
- b. Construct a bar graph similar to Figure 1.2 B.
- c. What can you say about how Skecher’s sales are changing over these four years?
Expert Solution & Answer

Trending nowThis is a popular solution!

Students have asked these similar questions
Which of the following time series forecasting methods would not be used to forecast seasonal data?
The following data set provides the total number of shipments of core major household appliances in the U.S. from 2000 to 2016 (in millions):
Year
Shipments (millions)
2000
38.4
2001
38.2
2002
40.8
2003
42.5
2004
46.1
2005
47.0
2006
46.7
2007
44.1
2008
39.8
2009
36.5
2010
38.2
2011
36.0
2012
35.8
2013
39.2
2014
41.5
2015
42.9
2016
44.7
a. Plot the time series.
b. Fit a three-year moving average to the data and plot the results.
c. Fit a five-year moving average to the data and plot the results.
d. Compute a linear trend forecasting equation and plot the trend line.
e. Compute a quadratic trend forecasting equation and plot the results.
Chapter 1 Solutions
Essentials Of Statistics For Business & Economics
Ch. 1 - Discuss the differences between statistics as...Ch. 1 - Tablet PC Comparison provides a wide variety of...Ch. 1 - Refer to Table 1.6.
What is the average cost for...Ch. 1 - Table 1.7 shows data for eight cordless telephones...Ch. 1 - Summarizing Phone Data. Refer to the data set in...Ch. 1 - J.D. Power and Associates surveys new automobile...Ch. 1 - Airline Customer Satisfaction. Many service...Ch. 1 - The Tennessean, an online newspaper located in...Ch. 1 - College-Educated Workers. Based on data from the...Ch. 1 - The Bureau of Transportation Statistics Omnibus...
Ch. 1 - Driverless Cars Expected Soon. A Gallup Poll...Ch. 1 - The Hawaii Visitors Bureau collects data on...Ch. 1 - Facebook Advertising Revenue. Figure 1.8 provides...Ch. 1 - Rental Car Fleet Size. The following data show the...Ch. 1 - Jewelry Sales. The U.S. Census Bureau tracks sales...Ch. 1 - Athletic Shoe Sales. Skechers U.S.A., Inc., is a...Ch. 1 - A manager of a large corporation recommends a...Ch. 1 - A random telephone survey of 1021 adults (aged 18...Ch. 1 - A Bloomberg Businessweek North American subscriber...Ch. 1 - A survey of 131 investment managers in Barron’s...Ch. 1 - A seven-year medical research study reported that...Ch. 1 - A survey conducted by Better Homes and Gardens...Ch. 1 - Teenage Cell Phone Use. Pew Research Center is a...Ch. 1 - A sample of midterm grades for five students...Ch. 1 - Comparing Compact SUVs. Consumer Reports evaluates...
Knowledge Booster


Learn more about
Need a deep-dive on the concept behind this application? Look no further. Learn more about this topic, statistics and related others by exploring similar questions and additional content below.Recommended textbooks for you
 Functions and Change: A Modeling Approach to Coll...AlgebraISBN:9781337111348Author:Bruce Crauder, Benny Evans, Alan NoellPublisher:Cengage Learning
 Glencoe Algebra 1, Student Edition, 9780079039897...AlgebraISBN:9780079039897Author:CarterPublisher:McGraw Hill
Functions and Change: A Modeling Approach to Coll...
Algebra
ISBN:9781337111348
Author:Bruce Crauder, Benny Evans, Alan Noell
Publisher:Cengage Learning
Glencoe Algebra 1, Student Edition, 9780079039897...
Algebra
ISBN:9780079039897
Author:Carter
Publisher:McGraw Hill
Time Series Analysis Theory & Uni-variate Forecasting Techniques; Author: Analytics University;https://www.youtube.com/watch?v=_X5q9FYLGxM;License: Standard YouTube License, CC-BY
Operations management 101: Time-series, forecasting introduction; Author: Brandoz Foltz;https://www.youtube.com/watch?v=EaqZP36ool8;License: Standard YouTube License, CC-BY