Spreadsheet Modeling & Decision Analysis: A Practical Introduction to Business Analytics (MindTap Course List)
8th Edition
ISBN: 9781305947412
Author: Cliff Ragsdale
Publisher: Cengage Learning
expand_more
expand_more
format_list_bulleted
Concept explainers
Videos
Textbook Question
Chapter 1, Problem 18QP
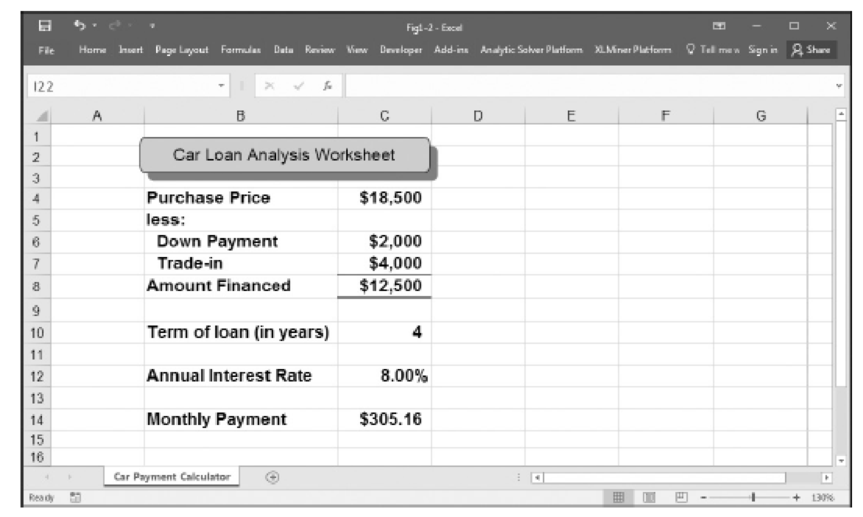
Consider the spreadsheet model shown in Figure 1.2. Is this model descriptive, predictive, or prescriptive in nature, or does it not fall into any of these categories?
Figure 1.2
Example of a simple spreadsheet model
Expert Solution & Answer
Want to see the full answer?
Check out a sample textbook solution
Students have asked these similar questions
Determine the type of business analytics for the following scenarios.
A. Imagine you are a meteorologist. You have to foretell the weather for the next two weeks by analysing the data from the satellites. Here, you have to apply advanced statistical, information software, or operations research methods to identify predictive variables and build predictive models. Discuss in detail which type of business analytics will be suitable for this scenario.
Sales for the past 12 months at computer success are given here:
January 3,000 July 6,300
february 3,400 August 7,200
March 3,700 Sept 6,400
April 4,100 Oct 4,600
May 4,700 Nov 4,200
June 5,700 December 3,900
a. Use a 3-month moving average to forecast the sales for the months May through December
b. Use a 4-month moving average to forecast the sales for the months May through December
C. Compare the performance of the two methods by using the mean absolute deviation as the performance criterion. Which method would you recommend?
d. Compare the performance of the two methods by using the mean absolute percent error as the performance criterion. Which method would you recommend?
e. Compare the performance of the two methods by using the mean squared error as the performance criterion. Which method would you recommend?
As a small business owner, Emil understands the importance of sales forecasting to entrepreneurial success. Which of the following is correct regarding a sales forecast? Organizations rely on correlation analyses as their exclusive sales forecasting method. It is an estimate of the amount of a product that an organization expects to sell during a certain period of time. The accuracy of a sales forecast is not important. It is based on an unspecified level of marketing effort. 4
Chapter 1 Solutions
Spreadsheet Modeling & Decision Analysis: A Practical Introduction to Business Analytics (MindTap Course List)
Ch. 1 - Prob. 1QPCh. 1 - Prob. 2QPCh. 1 - Prob. 3QPCh. 1 - Prob. 4QPCh. 1 - What is the relationship between business...Ch. 1 - What kinds of spreadsheet applications would not...Ch. 1 - Prob. 7QPCh. 1 - Prob. 8QPCh. 1 - What is a dependent variable?Ch. 1 - What is an independent variable?
Ch. 1 - Can a model have more than one dependent variable?Ch. 1 - Can a decision problem have more than one...Ch. 1 - Prob. 13QPCh. 1 - Prob. 14QPCh. 1 - In what ways are descriptive models different from...Ch. 1 - Prob. 16QPCh. 1 - Prob. 17QPCh. 1 - Consider the spreadsheet model shown in Figure...Ch. 1 - Prob. 19QPCh. 1 - Prob. 20QPCh. 1 - Prob. 21QPCh. 1 - Prob. 22QPCh. 1 - Prob. 23QPCh. 1 - Prob. 24QPCh. 1 - Prob. 25QPCh. 1 - Prob. 26QPCh. 1 - Prob. 27QP
Knowledge Booster


Learn more about
Need a deep-dive on the concept behind this application? Look no further. Learn more about this topic, management and related others by exploring similar questions and additional content below.Similar questions
- Stock market analysts are continually looking for reliable predictors of stock prices. Consider the problem of modeling the price per share of electric utility stocks (Y). Two variables thought to influence this stock price are return on average equity (X1) and annual dividend rate (X2). The stock price, returns on equity, and dividend rates on a randomly selected day for 16 electric utility stocks are provided in the file P13_15.xlsx. Estimate a multiple regression equation using the given data. Interpret each of the estimated regression coefficients. Also, interpret the standard error of estimate and the R-square value for these data.arrow_forwardThe file P13_26.xlsx contains the monthly number of airline tickets sold by the CareFree Travel Agency. a. Create a time series chart of the data. Based on what you see, which of the exponential smoothing models do you think will provide the best forecasting model? Why? b. Use simple exponential smoothing to forecast these data, using a smoothing constant of 0.1. c. Repeat part b, but search for the smoothing constant that makes RMSE as small as possible. Does it make much of an improvement over the model in part b?arrow_forwardThe file P13_19.xlsx contains the weekly sales of a particular brand of paper towels at a supermarket for a one-year period. a. Using a span of 3, forecast the sales of this product for the next 10 weeks with the moving averages method. How well does this method with span 3 forecast the known observations in this series? b. Repeat part a with a span of 10. c. Which of these two spans appears to be more appropriate? Justify your choice.arrow_forward
- The file P13_29.xlsx contains monthly time series data for total U.S. retail sales of building materials (which includes retail sales of building materials, hardware and garden supply stores, and mobile home dealers). a. Is seasonality present in these data? If so, characterize the seasonality pattern. b. Use Winters method to forecast this series with smoothing constants = = 0.1 and = 0.3. Does the forecast series seem to track the seasonal pattern well? What are your forecasts for the next 12 months?arrow_forwardThe file P13_28.xlsx contains monthly retail sales of U.S. liquor stores. a. Is seasonality present in these data? If so, characterize the seasonality pattern. b. Use Winters method to forecast this series with smoothing constants = = 0.1 and = 0.3. Does the forecast series seem to track the seasonal pattern well? What are your forecasts for the next 12 months?arrow_forwardThe file P13_27.xlsx contains yearly data on the proportion of Americans under the age of 18 living below the poverty level. a. Create a time series chart of the data. Based on what you see, which of the exponential smoothing models do you think will provide the best forecasting model? Why? b. Use simple exponential smoothing to forecast these data, using a smoothing constant of 0.1. c. Repeat part b, but search for the smoothing constant that makes RMSE as small as possible. Create a chart of the series with the forecasts superimposed from this optimal smoothing constant. Does it make much of an improvement over the model in part b? d. Write a short report to summarize your results. Considering the chart in part c, would you say the forecasts are good?arrow_forward
- The file P13_22.xlsx contains total monthly U.S. retail sales data. While holding out the final six months of observations for validation purposes, use the method of moving averages with a carefully chosen span to forecast U.S. retail sales in the next year. Comment on the performance of your model. What makes this time series more challenging to forecast?arrow_forwardThe file P13_42.xlsx contains monthly data on consumer revolving credit (in millions of dollars) through credit unions. a. Use these data to forecast consumer revolving credit through credit unions for the next 12 months. Do it in two ways. First, fit an exponential trend to the series. Second, use Holts method with optimized smoothing constants. b. Which of these two methods appears to provide the best forecasts? Answer by comparing their MAPE values.arrow_forwardThe file P13_02.xlsx contains five years of monthly data on sales (number of units sold) for a particular company. The company suspects that except for random noise, its sales are growing by a constant percentage each month and will continue to do so for at least the near future. a. Explain briefly whether the plot of the series visually supports the companys suspicion. b. By what percentage are sales increasing each month? c. What is the MAPE for the forecast model in part b? In words, what does it measure? Considering its magnitude, does the model seem to be doing a good job? d. In words, how does the model make forecasts for future months? Specifically, given the forecast value for the last month in the data set, what simple arithmetic could you use to obtain forecasts for the next few months?arrow_forward
- Which of the following is true about using forecasts? Forecast accuracy decreases the farther into the future you are trying to predict. Forecasts become more accurate when predicting further into the future. Forecasts are useless when the future will look radically different from the past. The more complex the forecast, the more accurate are the predictions. The accuracy of forecasts does not vary from one application to another.arrow_forwardParaphrase this one. Analyze and elaborate in 120 words. Predictive analytics involves a statistical approach called regression, which helps us uncover connections between different factors. This technique is valuable for spotting trends within extensive sets of information and figuring out how various inputs relate to each other. It shines brightest when dealing with continuous information that follows an established pattern. Regression frequently comes into play when we want to understand the impact of one or more independent factors on another. For instance, it aids in grasping the effect of raising prices on product sales. This tool holds the key to unraveling hidden insights in data that might otherwise remain unnoticed.arrow_forwardWhat type of analytics seeks to recognize what is going on as well as the likely forecast and make decisions to achieve the best performance possible? domain predictive prescriptive descriptive What does the robustness of a data mining method refer to? its ability to construct a prediction model efficiently given a large amount of data its speed of computation and computational costs in using the mode its ability to overcome noisy data to make somewhat accurate predictions its ability to predict the outcome of a previously unknown data set accuratelyarrow_forward
arrow_back_ios
SEE MORE QUESTIONS
arrow_forward_ios
Recommended textbooks for you
 Practical Management ScienceOperations ManagementISBN:9781337406659Author:WINSTON, Wayne L.Publisher:Cengage,
 MarketingMarketingISBN:9780357033791Author:Pride, William MPublisher:South Western Educational Publishing
Practical Management Science
Operations Management
ISBN:9781337406659
Author:WINSTON, Wayne L.
Publisher:Cengage,
Marketing
Marketing
ISBN:9780357033791
Author:Pride, William M
Publisher:South Western Educational Publishing
Introduction to Forecasting; Author: Ekeeda;https://www.youtube.com/watch?v=5eIbVXrJL7k;License: Standard YouTube License, CC-BY