EBK INTRODUCTION TO MANAGERIAL ACCOUNTI
8th Edition
ISBN: 9781260190229
Author: BREWER
Publisher: MCGRAW HILL BOOK COMPANY
expand_more
expand_more
format_list_bulleted
Videos
Textbook Question
Chapter 1, Problem 19P
Traditional and Contribution Format Income Statements
Todrick Company is a merchandiser that reported the following information based on 1,000 units sold: 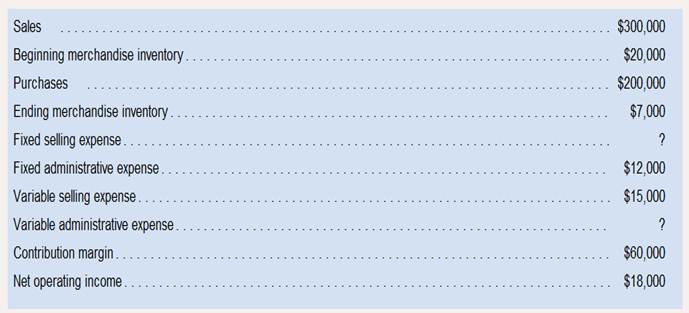
Required:
1. Prepare a contribution format income statement.
2. Prepare a traditional format income statement.
3. Calculate the selling price per unit.
4. Calculate the variable cost per unit.
5. Calculate the contribution margin per unit.
6. Which income statement format (traditional format or contribution format) would be more useful to managers in estimating how net operating income will change in responses to changes in unit sales? Why?
Expert Solution & Answer
Want to see the full answer?
Check out a sample textbook solution
Students have asked these similar questions
Cost of Goods Sold
As an accountant for Lee Company, your supervisor gave you the following calculations of the gross profit for the first quarter:
Alternative
Sales ($50 per unit)
Cost of Goods Sold
Gross Profit
A
$500,000
$200,000
$300,000
B
500,000
228,000
272,000
C
500,000
213,333
286,667
The three alternative cost flow assumptions are FIFO, average, and LIFO (the alternatives are not necessarily presented in this sequence). Lee uses the periodic inventory system. The computation of the cost of goods sold under each alternative is based on the following data:
Units
Cost/Unit
Inventory, January 1
12,000
$20
Purchase, January 10
4,000
21
Purchase, February 15
6,000
22
Purchase, March 10
8,000
23
1. Prepare schedules proving the cost of goods sold shown here under each of the three alternatives. For average cost.
LEE COMPANY
Schedules of Cost of Goods Sold
For First Quarter Ended March 31
FIFO
LIFO
Average
Beginning…
a. Present a cost-profit-volume analysis that shows the effect of adding the $8,500 annual
premium to the company's fixed costs by showing current and revised CVP Income Statements.
Include a column to the right of each income statement where each line item is expressed as a
percentage of sales (called a common size income statement).
b. Visualize the changes to net income in a chart.
c. Advise the company using your quantitative support and qualitative. reasoning as to whether
the company should purchase the insurance.
A-Float Pools Company
Income Statement (Pools Maintenance Div.)
For the Year Ended December 31, 2022
In
Sales (2,000 clients)
Cost of Services
Gross profit
Operating expenses
Selling
Administrative
Net Income
$165,000
$225,000
$1,100,000
627,000
$473,000
$390,000
$83.000
APPLY THE CONCEPTS: Target income (sales revenue)
Another useful method for figuring out the type of performance your company will need to reach a target income is by using sales revenue. Rather than using the number of units, this method uses total sales revenue. In companies for which the total set of goods produced and sold is more varied, this would be the preferred method, as opposed to a business in which only one product is sold. Assume a company has pricing and cost information as follows:
Price and Cost Information
Amount
Selling Price per Unit
$30
Variable Cost per Unit
$15
Total Fixed Cost
$15,000
For the upcoming period, the company wishes to generate operating income of $40,000. Given the cost and pricing structure for the company’s product, how much sales revenue must it generate to attain its target income?
Step 1: Calculate the contribution margin ratio:
The contribution margin ratio is the contribution margin in proportion to the selling price on a…
Chapter 1 Solutions
EBK INTRODUCTION TO MANAGERIAL ACCOUNTI
Ch. 1 - What are the three major types of product costs in...Ch. 1 - Define the following: (a) Direct materials, (b)...Ch. 1 - Explain the difference between a product cost and...Ch. 1 - Distinguish between (a) a variable cost, (b) a...Ch. 1 - What effect does an increase in the activity level...Ch. 1 - Define the following terms: (a) Costbehavior and...Ch. 1 - What is meant by an activity base when dealing...Ch. 1 - Managers often assume a strictly linear...Ch. 1 - Distinguish between discretionary fixed costs and...Ch. 1 - Does the concept of the relevant range apply to...
Ch. 1 - What is the difference between a traditional...Ch. 1 - Prob. 12QCh. 1 - Define the following terms: differential cost,...Ch. 1 - Only variable costs can be differential costs. Do...Ch. 1 - Prob. 1AECh. 1 - This Excel worksheet form is to be used to...Ch. 1 - Martinez Company’s relevant range of production is...Ch. 1 - Martinez Company’s relevant range of production is...Ch. 1 - Martinez Company’s relevant range of production is...Ch. 1 - Prob. 4F15Ch. 1 - Prob. 5F15Ch. 1 - Martinez Company’s relevant range of production is...Ch. 1 - Martinez Company’s relevant range of production is...Ch. 1 - Prob. 8F15Ch. 1 - Martinez Company’s relevant range of production is...Ch. 1 - Martinez Company’s relevant range of production is...Ch. 1 - Martinez Company’s relevant range of production is...Ch. 1 - Martinez Company’s relevant range of production is...Ch. 1 - Martinez Company’s relevant range of production is...Ch. 1 - Martinez Company’s relevant range of production is...Ch. 1 - Prob. 15F15Ch. 1 - Identifying Direct and Indirect Costs Northwest...Ch. 1 - Prob. 2ECh. 1 - Classifying Costs as Product or Period Costs...Ch. 1 - Prob. 4ECh. 1 - Prob. 5ECh. 1 - Traditional and Contribution Format Income...Ch. 1 - Direct and Indirect CostsKubin Company’s relevant...Ch. 1 - Product Costs and Period Costs; Variable and Fixed...Ch. 1 - Fixed, Variable, and Mixed Costs Refer to the data...Ch. 1 - Differential Costs and Sunk Costs Refer to the...Ch. 1 - Cost Behavior; Contribution Format Income...Ch. 1 - Product and Period Cost Flows The Devon Motor...Ch. 1 - Prob. 13ECh. 1 - Cost Classification Wollogong Group Ltd. of New...Ch. 1 - Traditional and Contribution Format Income...Ch. 1 - Cost Classifications for Decision Making Warner...Ch. 1 - Classifying Variable and Fixed Costs and Product...Ch. 1 - PROBLEM 1—18 Direct and Indirect Costs; Variable...Ch. 1 - Traditional and Contribution Format Income...Ch. 1 - Variable and Fixed Costs; Subtleties of Direct and...Ch. 1 - Traditional and Contribution Format Income...Ch. 1 - Cost Terminology; Contribution Format Income...Ch. 1 - Cost Classification Listed below are costs found...Ch. 1 - Different Cost Classifications for Different...Ch. 1 - Traditional and Contribution Format Income...
Knowledge Booster


Learn more about
Need a deep-dive on the concept behind this application? Look no further. Learn more about this topic, accounting and related others by exploring similar questions and additional content below.Similar questions
- Inventory Valuation under Variable Costing Refer to the data for Judson Company above. Required: 1. How many units are in ending inventory? 2. Using variable costing, calculate the per-unit product cost. 3. What is the value of ending inventory under variable costing? Use the following information for Brief Exercises 3-21 and 3-22: During the most recent year, Judson Company had the following data associated with the product it makes:arrow_forwardTodrick Company is a merchandiser that reported the following information based on 1,000 units sold: Sales Beginning merchandise inventory Purchases Ending merchandise inventory Fixed selling expense Fixed administrative expense Variable selling expense Variable administrative expense Contribution margin Net operating income Req 1 Required: 1. Prepare a contribution format income statement. 2. Prepare a traditional format income statement. 3. Calculate the selling price per unit. 4. Calculate the variable cost per unit. 5. Calculate the contribution margin per unit. 6. Which income statement format (traditional format or contribution format) would be more useful to managers in estimating how net operating income will change in responses to changes in unit sales? Req 2 Complete this question by entering your answers in the tabs below. Req 3 to 5 $ 240,000 $ 16,000 $ 160,000 8,000 ? 9,600 12,000 ? 48,000 $ 14,400 $ $ $ Prepare a traditional format income statement. $ $ $ Selling and…arrow_forwardMatch each of the following descriptions with the appropriate term. Clear All Plots only the difference between total sales and total costs Indicates the possible decrease in sales that may occur before operating loss results Graphically shows costs, sales, and operating profit or loss at various levels of units sold The relative distribution of sales among products sold by a company Contribution margin divided by operating income Margin of safety Operating leverage Profit-volume chart Sales mix Cost-volume-profit chart mg maltarrow_forward
- Todrick Company is a merchandiser that reported the following information based on 1,000 units sold: Sales Beginning merchandise inventory Purchases Ending merchandise inventory Fixed selling expense Fixed administrative expense Variable selling expense Variable administrative expense Contribution margin Net operating income Req 1 Required: 1. Prepare a contribution format income statement. 2. Prepare a traditional format income statement. 3. Calculate the selling price per unit. 4. Calculate the variable cost per unit. 5. Calculate the contribution margin per unit. 6. Which income statement format (traditional format or contribution format) would be more useful to managers in estimating how net operating income will change in responses to changes in unit sales? Req 2 Complete this question by entering your answers in the tabs below. $ 240,000 $ 16,000 $ 160,000 $ 8,000 ? $ 9,600 12,000 ? 48,000 $ 14,400 Req 3 to 5 3. Calculate the selling price per unit. 4. Calculate the variable cost…arrow_forwardRequired: 1. Prepare a contribution format income statement. 2. Prepare a traditional format income statement. 3. Calculate the selling price per unit. 4. Calculate the variable cost per unit. 5. Calculate the contribution margin per unit. 6. Which income statement format (traditional format or contribution format) would be more useful to managers in estimating how net operating income will change in responses to changes in unit sales?arrow_forwardFill in the missing amounts in each of the eight case situations below. Each case is independent of the others. (Hint: One way to find the missing amounts would be to prepare a contribution format income statement for each case, enter the known data, and then compute the missing items.) Required: a. Assume that only one product is being sold in each of the following four case situations: Unit sold Sales Variable expenses Foxed expenses Operating income (loss) Contribution margin per unit $ Case #1 15,000 180,000 $ 100,000 120,000 50,000 $ $ Case #2 Case #1 Case #3 10,000 Case #2 70,000 $ 32,000 8,000 $ 12,000 $ 10 $ 13 Case #4 b. Assume that more than one product is being sold in each of the following four case situations: (Enter "Contribution margin ratio" in percent. Round your final answers to the nearest whole dollar amount.) Case #3 6,000 300,000 100,000 (10,000) Case #4arrow_forward
- What can the weighted average contribution margin ratio be used for? Multiple Choice To solve for a measure, at any level of sales volume, of the sensitivity of operating profit to changes in volume. Breakeven and profit planning for sales volume expressed in dollars (Y) rather than units (Q). To calculate an average per-unit contribution margin based on an assumed sales mix. To figure out the relative proportion in which a company’s products (or services) are sold. To determine the extent of fixed costs in an organization’s cost structure.arrow_forwardWhat can the weighted average contribution margin ratio be used for? To solve for a measure, at any level of sales volume, of the sensitivity of operating profit to changes in volume. Breakeven and profit planning for sales volume expressed in dollars (Y) rather than units (Q). To calculate an average per-unit contribution margin based on an assumed sales mix. To figure out the relative proportion in which a company’s products (or services) are sold. To determine the extent of fixed costs in an organization’s cost structure.arrow_forwardMatch each of the following descriptions with the appropriate term. Clear All Plots only the difference between total sales and total costs Indicates the possible decrease in sales that may occur before operating loss results Graphically shows costs, sales, and operating profit or loss at various levels of units sold The relative distribution of sales among products sold by a company Contribution margin divided by operating income Profit-volume chart Cost-volume-profit chart Operating leverage Margin of safety Sales mixarrow_forward
- Fill in the missing amounts in each of the eight case situations below. Each case is independent of the others. (Hint: One way to find the missing amounts would be to prepare a contribution format income statement for each case, enter the known data, and then compute the missing items.) Required: a. Assume that only one product is being sold in each of the following four case situations: Unit sold Sales Variable expenses Fixed expenses Operating income (loss) Contribution margin per unit Sales Variable expenses Fixed expenses $ Operating income (loss) Average contribution margin (percentage) Case #1 20,100 241,200 $ 160,800 67,000 $ Case #2 S $ $ Case #1 134,000 42,880 10,720 S 10 S 8,700 20% b. Assume that more than one product is being sold in each of the following four case situations. (Enter "Contribution margin ratio" in percent. Round your final answers to the nearest whole dollar amount.) 534,000 $ Case #3 Case #2 13,400 434,000 282,100 108,500 93,800 Case #4 8,040 S 402,000…arrow_forwardFill in the missing amounts in each of the eight case situations below. Each case Is Independent of the others. (Hint: One way to find the missing amounts would be to prepare a contribution format Income statement for each case, enter the known data, and then compute the missing items.) Required: a. Assume that only one product is being sold in each of the following four case situations: Unit sold Sales Variable expenses Fixed expenses Operating income (loss) Contribution margin per unit Sales Variable expenses Fixed expenses $ Operating income (loss) Average contribution margin (percentage) Case #1 20,400 244,800 163,200 68,000 $ $ 136,000 $ 10 Case #2 $ Case #1 536,000 43,520 10.880 $ 8,800 20% 10 $ 69 Case #3 Case #2 13,600 b. Assume that more than one product is being sold in each of the following four case situations: (Enter "Contribution margin ratio" in percent. Round your final answers to the nearest whole dollar amount.) 436.000 283.400 109.000 95,200 16,320 13 $ S CA Case #4…arrow_forwardUsing the table below, create a line chart in which profit or loss is plotted on the Y-axis and sales volume is plotted on the X-axis. This is commonly called a profit/volume chart. Although sales volume can be expressed in either units or dollars, use units for your chart. Complete the Chart Tickler Data Table to include a column for profits. Use this table as a basis for preparing the chart. Cost-Volume-Profit Analysis Data Section Income Statement in a Contribution Margin Fixed Variable Particulars Amounts Production costs Projected unit sales 120,000 Direct materials $2.30 Selling price per unit $16.00 Direct labor 4.70 Less Vairable Cost Factory overhead $225,000 3.00 Direct materials $2.30 Selling expenses Direct labor 4.70 Sales salaries & commissions 97,000 0.75 Factory overhead…arrow_forward
arrow_back_ios
SEE MORE QUESTIONS
arrow_forward_ios
Recommended textbooks for you
 Managerial Accounting: The Cornerstone of Busines...AccountingISBN:9781337115773Author:Maryanne M. Mowen, Don R. Hansen, Dan L. HeitgerPublisher:Cengage Learning
 Managerial AccountingAccountingISBN:9781337912020Author:Carl Warren, Ph.d. Cma William B. TaylerPublisher:South-Western College Pub
 Financial And Managerial AccountingAccountingISBN:9781337902663Author:WARREN, Carl S.Publisher:Cengage Learning,
 Intermediate Accounting: Reporting And AnalysisAccountingISBN:9781337788281Author:James M. Wahlen, Jefferson P. Jones, Donald PagachPublisher:Cengage Learning
Managerial Accounting: The Cornerstone of Busines...
Accounting
ISBN:9781337115773
Author:Maryanne M. Mowen, Don R. Hansen, Dan L. Heitger
Publisher:Cengage Learning
Managerial Accounting
Accounting
ISBN:9781337912020
Author:Carl Warren, Ph.d. Cma William B. Tayler
Publisher:South-Western College Pub
Financial And Managerial Accounting
Accounting
ISBN:9781337902663
Author:WARREN, Carl S.
Publisher:Cengage Learning,
Intermediate Accounting: Reporting And Analysis
Accounting
ISBN:9781337788281
Author:James M. Wahlen, Jefferson P. Jones, Donald Pagach
Publisher:Cengage Learning
What is Risk Management? | Risk Management process; Author: Educationleaves;https://www.youtube.com/watch?v=IP-E75FGFkU;License: Standard youtube license