Videos
In Problems 1–3, use point-by-point plotting to sketch the graph of each equation.
1. y = 5 − x2
To sketch: The graph of the equation
Explanation of Solution
The given equation is
Choose integer values for x and find the corresponding ordered pairs of
The value of y for different x values for the equation
| x | |
| –2 | 1 |
| –1 | 4 |
| 0 | 5 |
| 1 | 4 |
| 2 | 1 |
Table 1
Use the above ordered pairs to sketch the graph of the equation
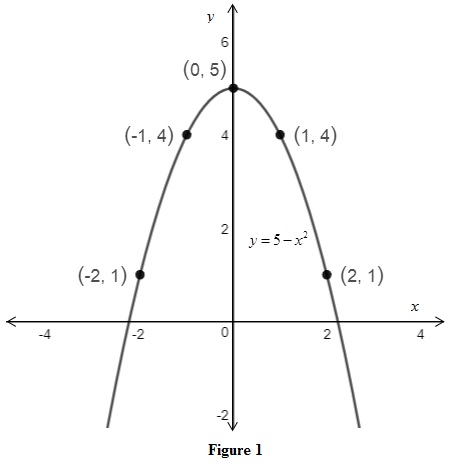
From Figure 1, it is observed that the graph of the equation
Want to see more full solutions like this?
Chapter 1 Solutions
Calculus for Business, Economics, Life Sciences, and Social Sciences, Brief Version, and MyLab Math with Pearson eText -- Title-Specific Access Card . Byleen & Stocker, Applied Math Series)


 Algebra: Structure And Method, Book 1AlgebraISBN:9780395977224Author:Richard G. Brown, Mary P. Dolciani, Robert H. Sorgenfrey, William L. ColePublisher:McDougal Littell