Videos
To identify: the function graph as linear and non-linear. Then estimate and interpret the intercepts of the graph, any symmetry, where the function is positive, negative, increasing and decreasing, x-coordinate of relative extrema and end behavior of the graph.
Explanation of Solution
Given information:
A figure is given as follows-
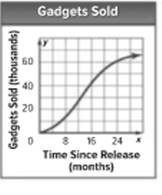
The given graph is non-linear because this is a curve and not a straight line.
Since, the given graph function passes through origin, so it does not form any intercepts with x-axis and y-axis.
The given graph function is always positive because it lie between positive axes of xy plane.
According to the given figure as time passes number of gadgets sold increases. So it is an increasing function.
There is no any symmetry and relative extrema.
The end behavior of graph is that if values on x-axis is further increases then values on y-axis will also increase.
Chapter 1 Solutions
Algebra 1, Homework Practice Workbook (MERRILL ALGEBRA 1)
Additional Math Textbook Solutions
Linear Algebra and Its Applications (5th Edition)
College Algebra
College Algebra
College Algebra (7th Edition)
PREALGEBRA


 Algebra and Trigonometry (6th Edition)AlgebraISBN:9780134463216Author:Robert F. BlitzerPublisher:PEARSON
 Contemporary Abstract AlgebraAlgebraISBN:9781305657960Author:Joseph GallianPublisher:Cengage Learning
 Linear Algebra: A Modern IntroductionAlgebraISBN:9781285463247Author:David PoolePublisher:Cengage Learning
 Algebra And Trigonometry (11th Edition)AlgebraISBN:9780135163078Author:Michael SullivanPublisher:PEARSON
 Introduction to Linear Algebra, Fifth EditionAlgebraISBN:9780980232776Author:Gilbert StrangPublisher:Wellesley-Cambridge Press
 College Algebra (Collegiate Math)AlgebraISBN:9780077836344Author:Julie Miller, Donna GerkenPublisher:McGraw-Hill Education