
Loose-leaf For Applied Statistics In Business And Economics
5th Edition
ISBN: 9781259328527
Author: David Doane, Lori Seward Senior Instructor of Operations Management
Publisher: McGraw-Hill Education
expand_more
expand_more
format_list_bulleted
Concept explainers
Videos
Textbook Question
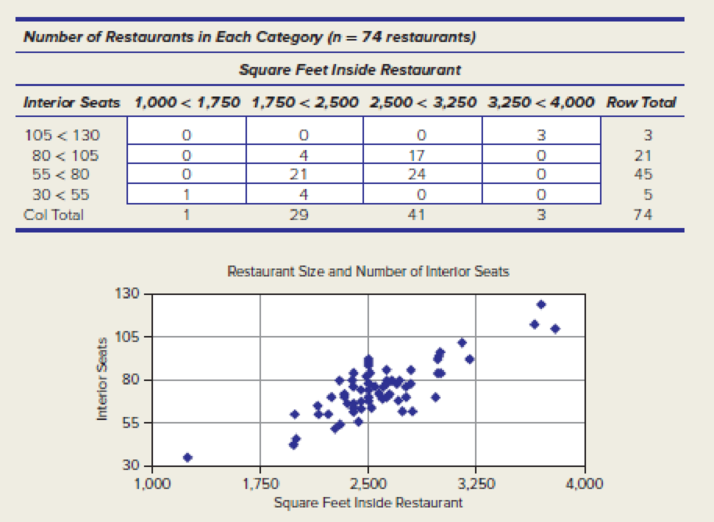
Chapter 1, Problem 28CE
- (a) Which of these two displays (table or graph) is more helpful in visualizing the relationship
- (b) between restaurant size and interior seating for 74 Noodles restaurants? Explain your reasoning, (b) Do you see anything unusual in the data? (Source: Noodles & Company) NoodlesSqFt
Expert Solution & Answer
Want to see the full answer?
Check out a sample textbook solution
Students have asked these similar questions
Find an example of a Health or Medicine bar graph and a histogram arising from data in that area. For your example, use the bar graph and the histogram to explain what the data being represented is for the bar graph and the histogram.
What is data?
Does the mean represent the center of the data?
Chapter 1 Solutions
Loose-leaf For Applied Statistics In Business And Economics
Ch. 1.3 - Give an example of how statistics might be useful...Ch. 1.3 - Give an example of how statistics might be useful...Ch. 1.3 - (a) Should the average business school graduate...Ch. 1.3 - Many college graduates will not use very much...Ch. 1.5 - Recently, the same five winning numbers (4, 21,...Ch. 1.5 - A National Health Interview Survey conducted by...Ch. 1.5 - A study found that radar detector users have lower...Ch. 1.5 - A lottery winner told how he picked his six-digit...Ch. 1.5 - Smokers are much more likely to speed, run red...Ch. 1.5 - An ad for a cell phone service claims that its...
Ch. 1.5 - What logical or ethical problems do you see in...Ch. 1.5 - A recent study of 231,164 New Jersey heart attack...Ch. 1.5 - When Pennsylvania repealed a law that required...Ch. 1 - Define (a) statistic; (b) statistics.Ch. 1 - List three reasons to study statistics.Ch. 1 - List three applications of statistics.Ch. 1 - List four skills needed by statisticians. Why are...Ch. 1 - List three practical challenges faced by...Ch. 1 - List three ethical challenges faced by...Ch. 1 - List five pitfalls or logical errors that may...Ch. 1 - A survey of beginning students showed that a...Ch. 1 - Under a recent U.S. Food and Drug Administration...Ch. 1 - A statistical consultant was retained by a linen...Ch. 1 - Ergonomics is the science of making sure that...Ch. 1 - Analysis of 1,064 deaths of famous popular...Ch. 1 - Prob. 22CECh. 1 - Prob. 23CECh. 1 - A European study of thousands of men found that...Ch. 1 - A research study showed that 7 percent of A...Ch. 1 - A research study showed that adolescents who...Ch. 1 - Prob. 27CECh. 1 - (a) Which of these two displays (table or graph)...Ch. 1 - (a) Which of these two displays (table or graph)...
Knowledge Booster


Learn more about
Need a deep-dive on the concept behind this application? Look no further. Learn more about this topic, statistics and related others by exploring similar questions and additional content below.Similar questions
- Explain if two variables consist of nominal data?arrow_forwardThe graph shows the heights of mothers and daughters. (Source: StatCrunch: Mother and Daughter Heights.xls. Owner: craig slinkman) (a) As the data are graphed, which is the independent variable and which the dependent variable? (b) From the graph, approximate the predicted height of the daughter of a mother who is 60 inches (5feet) tall. (c) From the equation, determine the predicted height of the daughter of a mother who is 60 inches tall. (d) Interpret the slope. (e) What other factors besides the mother's height might influence the daughter’s height?arrow_forwardResearchers initiated a long-term study of the population of American black bears. One aspect of the study was to develop a model that could be used to predict a bear's weight (since it is not practical to weigh bears in the field). One variable thought to be related to weight is the length of the bear. The accompanying data represent the lengths and weights of 12 American black bears. Complete parts (a) through (d) below. Click the icon to view the data table. Click the icon to view the critical values table. ..... (a) Which variable is the explanatory variable based on the goals of the research? O A. The number of bears B. The weight of the bear O C. The length of the bear (b) Draw a scatter diagram of the data. Choose the correct graph below. O A. O B. O C. D. A Weight (kg) 180- AWeight (kg) 180- ALength (cm) 180- A Weight (kg) 180- 40- 100 40- 100 Length (cm) 40- 100 40- 100 200 200 200 200 Length (cm) Weight (kg) Length (cm) (c) Determine the linear correlation coefficient between…arrow_forward
arrow_back_ios
arrow_forward_ios
Recommended textbooks for you
 Glencoe Algebra 1, Student Edition, 9780079039897...AlgebraISBN:9780079039897Author:CarterPublisher:McGraw Hill
 Holt Mcdougal Larson Pre-algebra: Student Edition...AlgebraISBN:9780547587776Author:HOLT MCDOUGALPublisher:HOLT MCDOUGAL
 Big Ideas Math A Bridge To Success Algebra 1: Stu...AlgebraISBN:9781680331141Author:HOUGHTON MIFFLIN HARCOURTPublisher:Houghton Mifflin Harcourt
 Algebra: Structure And Method, Book 1AlgebraISBN:9780395977224Author:Richard G. Brown, Mary P. Dolciani, Robert H. Sorgenfrey, William L. ColePublisher:McDougal Littell
 Elementary AlgebraAlgebraISBN:9780998625713Author:Lynn Marecek, MaryAnne Anthony-SmithPublisher:OpenStax - Rice University
Glencoe Algebra 1, Student Edition, 9780079039897...
Algebra
ISBN:9780079039897
Author:Carter
Publisher:McGraw Hill
Holt Mcdougal Larson Pre-algebra: Student Edition...
Algebra
ISBN:9780547587776
Author:HOLT MCDOUGAL
Publisher:HOLT MCDOUGAL
Big Ideas Math A Bridge To Success Algebra 1: Stu...
Algebra
ISBN:9781680331141
Author:HOUGHTON MIFFLIN HARCOURT
Publisher:Houghton Mifflin Harcourt
Algebra: Structure And Method, Book 1
Algebra
ISBN:9780395977224
Author:Richard G. Brown, Mary P. Dolciani, Robert H. Sorgenfrey, William L. Cole
Publisher:McDougal Littell
Elementary Algebra
Algebra
ISBN:9780998625713
Author:Lynn Marecek, MaryAnne Anthony-Smith
Publisher:OpenStax - Rice University
The Shape of Data: Distributions: Crash Course Statistics #7; Author: CrashCourse;https://www.youtube.com/watch?v=bPFNxD3Yg6U;License: Standard YouTube License, CC-BY
Shape, Center, and Spread - Module 20.2 (Part 1); Author: Mrmathblog;https://www.youtube.com/watch?v=COaid7O_Gag;License: Standard YouTube License, CC-BY
Shape, Center and Spread; Author: Emily Murdock;https://www.youtube.com/watch?v=_YyW0DSCzpM;License: Standard Youtube License