
Concept explainers
Explain the reason for classifying the freeway with a ramp metering system as a system with a feedback.
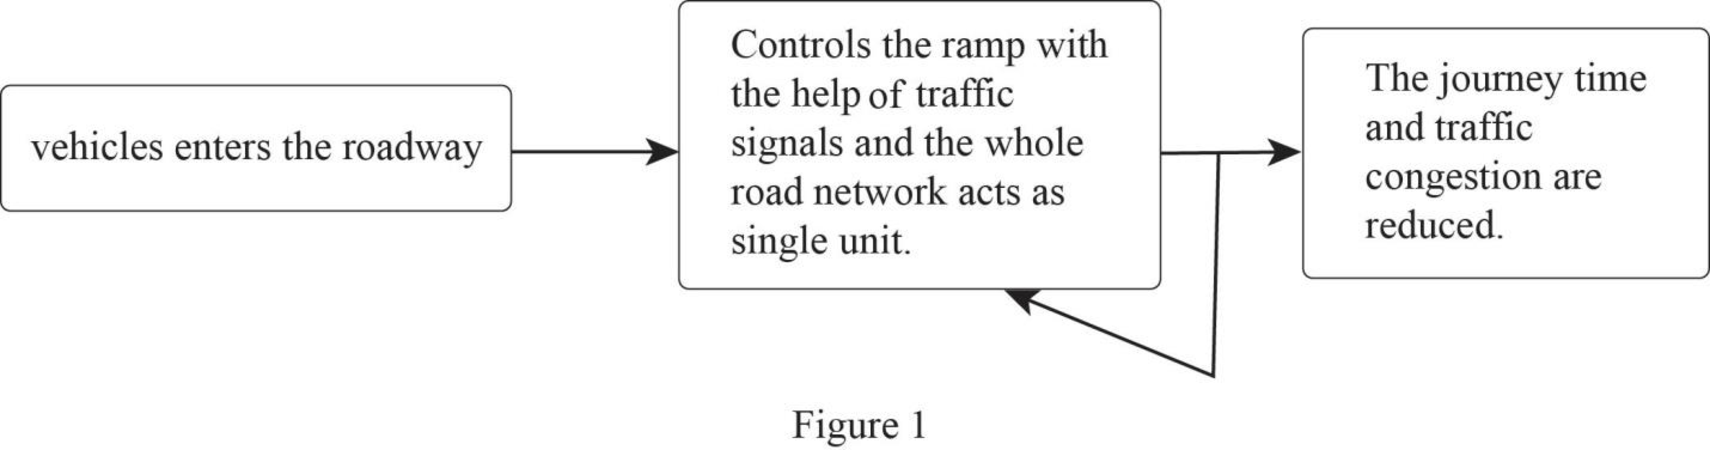
Sketch a flowchart similar to that of Figure 1.11 and label the lines and boxes with terms applicable to access the control of a freeway.
Explanation of Solution
Ramp metering system:
- 1. The ramp metering system is used to regulate the volume of traffic that enters the freeways, depending upon the current traffic conditions.
- 2. The usage of this system reduces the traffic congestion and improves the safety of the driver.
- 3. The ramp metering system has two signals namely red and green signals.
The classification of this system as a system with a feedback relies on the fact that the system has significant input and output with a positive consequence (feedback) over the environment.
For example, the output of the ramp metering system are less traffic congestion, reduced pollution, and increased driver safety. These outputs show that the feedback is positive and also the system is most suited to the environment.
Sketch the flowchart for the ramp metering system as shown in Figure 1.
Want to see more full solutions like this?
Chapter 1 Solutions
EBK INTRODUCTION TO SUSTAINABLE CIVIL E


- Q) Benefits of monitoring traffic please explain correctly with detailsarrow_forwardA traffic stream display average vehicle time headway of 2 sec at space mean speed 60 km/hr compute average space headway, flow rate and density for traffic stream?arrow_forward28 pedestrians per cycle (both directions combined) use a crosswalk to cross a 72-ft wide street. The width of the crosswalk is 11 ft. If the walking speed is 3.5 ft/s, how much τi,ps should be allocated so that the pedestrians can safely cross? Group of answer choices 31.0 sec 21.2 sec 56 sec 52.8 secarrow_forward
- When precisely do traffic analysis and monitoring become useful?arrow_forwardWhere exactly does the analysis and monitoring of traffic come into play?arrow_forwardAssume vehicle arrivals are random. On average, six vehicles arrive in one minute. Calculate theprobability of observing less than three vehicles over three minutes. Calculate the probability ofobserving a headway of less than eight seconds.arrow_forward
- When do traffic analysis and monitoring become useful?arrow_forwardExplain What factors determine the requirements for traffic control and safety hardware management data collection survey frequencies?arrow_forwardWhat count period would you choose for the volume study at the intersection with signal cycle length (a) 60 seconds, (b) 90 seconds, and (c) 120 seconds?arrow_forward
- Compare and contrast the different metering systems that are used in traffic-signal ramp control indicating under what conditions you will use each.arrow_forward1. A study of freeway flow at a given site has yielded a relationship speed-density calibrated as follows: S = 57,5(1 - 0,008 D) For this relationship, specify: (a) free flow velocity, (b) congestion density, (c) velocity-flow relationship (d) flow density relationship, and (e) capacity. 2. Answer all the questions in Problem 1 for the calibrated density-velocity relationship the following: S = 61.2e^-0015Darrow_forward
 Traffic and Highway EngineeringCivil EngineeringISBN:9781305156241Author:Garber, Nicholas J.Publisher:Cengage Learning