
Videos
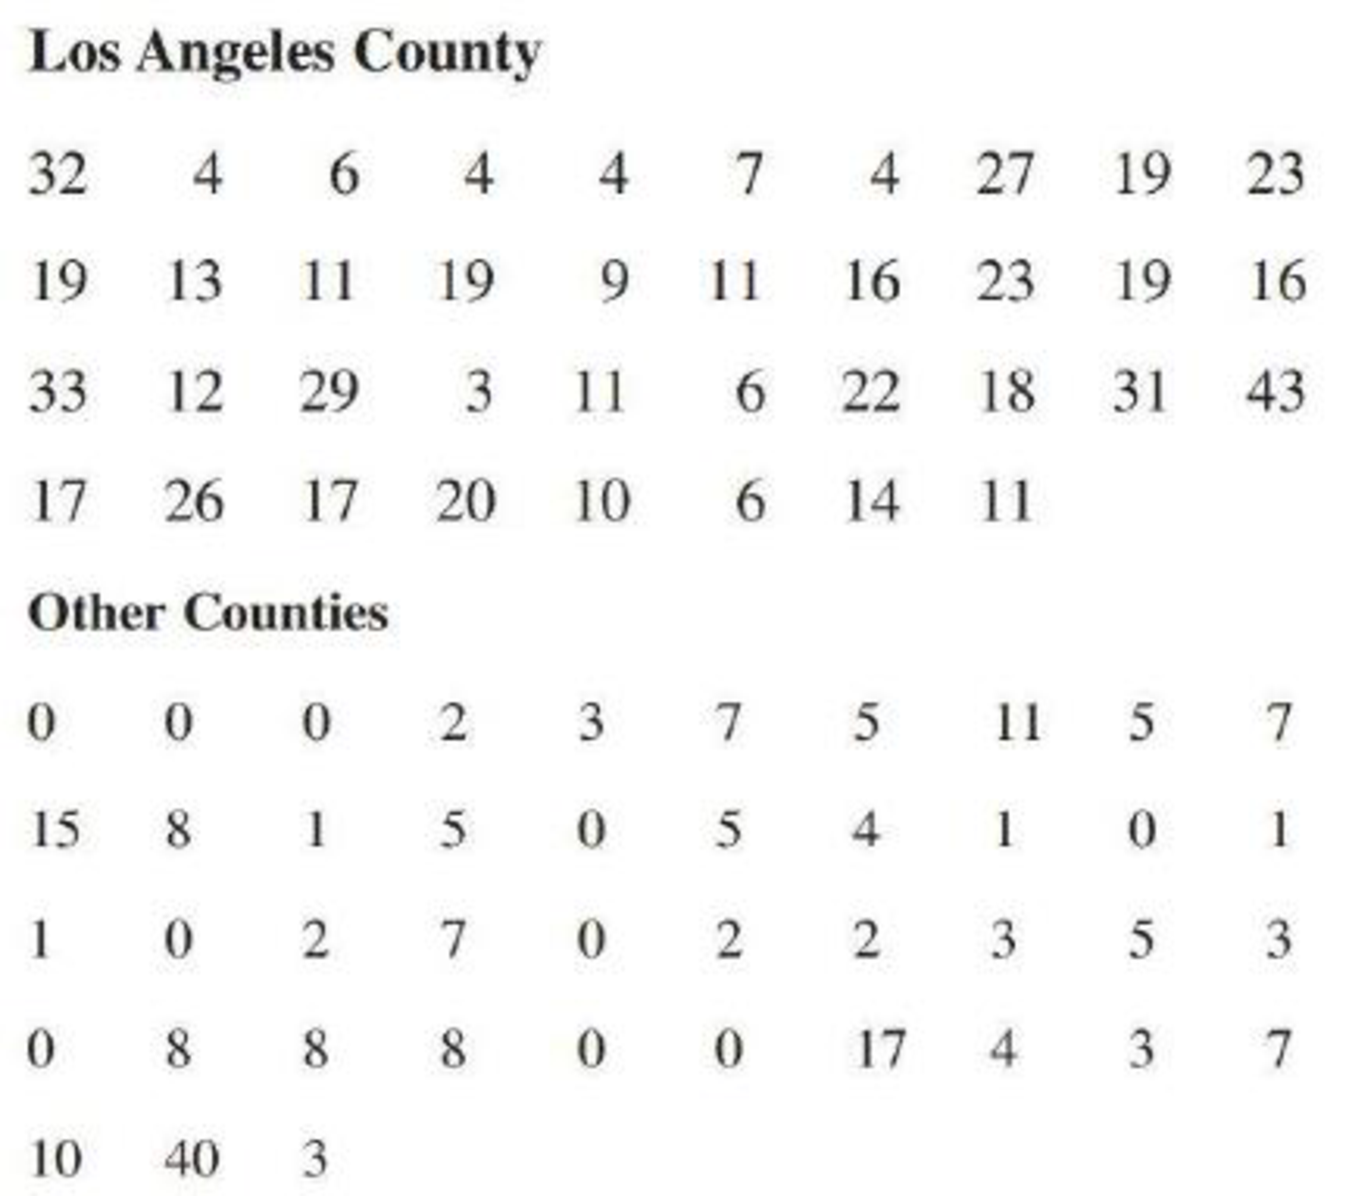
The report “Testing the Waters 2009” (nrdc.org) included information on the water quality at the 82 most popular swimming beaches in California. Thirty-eight of these beaches are in Los Angeles
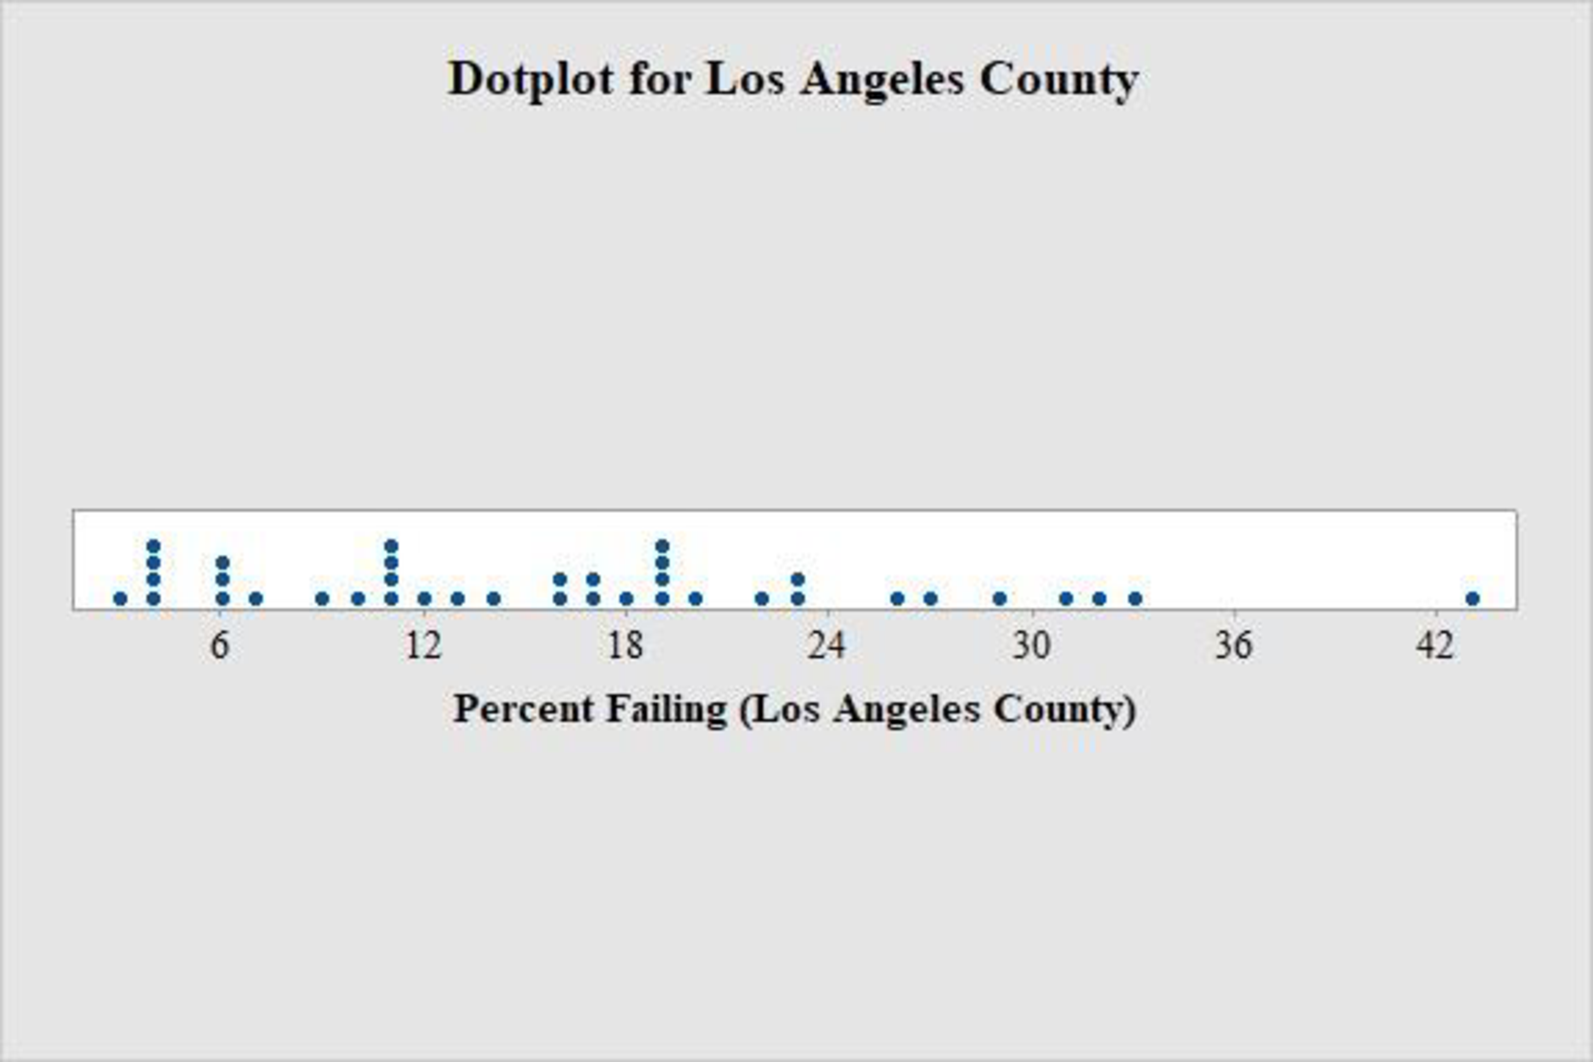
- a. Construct a dotplot of the percent of tests failing to meet water quality standards for the Los Angeles County beaches. Write a few sentences describing any interesting features of the dotplot.
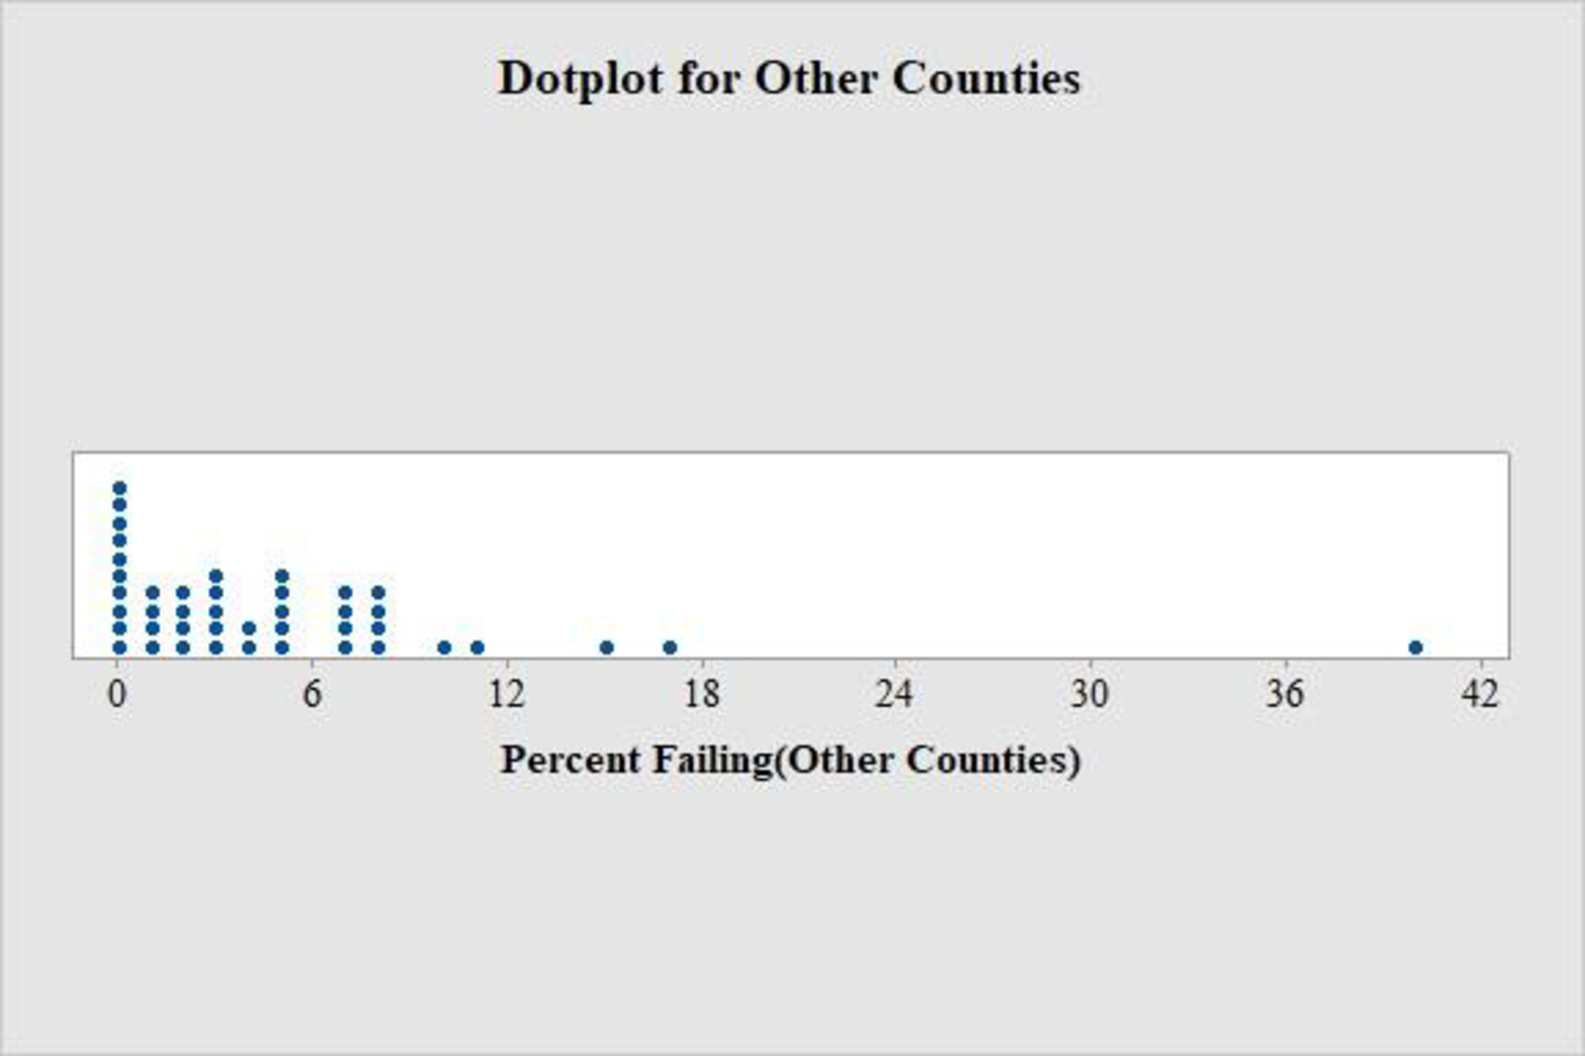
- b. Construct a dotplot of the percent of tests failing to meet water quality standards for the beaches in other counties. Write a few sentences describing any interesting features of the dotplot.
- c. Based on the two dolplots from Parts (a) and (b), describe how the percent of tests that fail to meet water quality standards for beaches in Los Angeles County differs from those of other counties.
a.
Sketch the dot plot of the percent of tests failing to meet water quality standards for the County LA.
Explain the features of the dot plot.
Answer to Problem 32CR
The dot plot is given below:
Explanation of Solution
Calculation:
The given information is the water quality of 82 beaches in County LA and other counties.
Software procedure:
Step-by-step procedure to obtain the dotplot using MINITAB software is given below:
- Choose Graph > Dot plot.
- Choose One Y-Simple and then click OK.
- In Graph variables, enter the column of Los Angeles County.
- Click OK.
From the dot plot, it is clear that, an unusually high value in the data is 43. Almost all the data points are lie between 2 and 33. Most of the observations are in the lower end compared to the upper end. A representative value of the data is around 16.
b.
Sketch the dot plot of the percent of tests failing to meet water quality standards for the beaches in the other counties.
Explain the features of the dot plot.
Answer to Problem 32CR
The dot plot is given below:
Explanation of Solution
Calculation:
Dotplot:
Software procedure:
Step-by-step procedure to obtain the dotplot using MINITAB software is given below:
- Choose Graph > Dot plot.
- Choose One Y-Simple and then click OK.
- In Graph variables, enter the column of Other Counties.
- Click OK.
From the dot plot, it is clear that, an unusually high value in the data is 40. Almost all the data points are lie between 0 and 17. Most of the observations are in the lower end compared to the upper end. A representative value of the data is around 3.
c.
Compare the percent of tests failing to meet water quality standards for the beaches in the County LA and other counties
Explanation of Solution
From the dot plot obtained in Part (a) and (b), a representative value for County LA is around 16 and that of other countries are around 3. That is, the representative value is high for County LA. Both dotplots contain an extreme value. The distribution of County LA is nearly uniform. However, that of other countries are right skewed.
Want to see more full solutions like this?
Chapter 1 Solutions
INTRO.TO STATS.+DATA ANALYS. W/WEBASSI


 Glencoe Algebra 1, Student Edition, 9780079039897...AlgebraISBN:9780079039897Author:CarterPublisher:McGraw Hill
 Holt Mcdougal Larson Pre-algebra: Student Edition...AlgebraISBN:9780547587776Author:HOLT MCDOUGALPublisher:HOLT MCDOUGAL
 Elementary Geometry For College Students, 7eGeometryISBN:9781337614085Author:Alexander, Daniel C.; Koeberlein, Geralyn M.Publisher:Cengage,