Sub part (a):
The possible combination of consumption of two goods.
Sub part (a):
Explanation of Solution
The consumption bundle of two goods can be calculated by using the following formula.
Substitute the respective values in equation (1) to calculate the number of peanut bags purchased while consuming 0 units of candy bars.
When the person consumes 0 quantities of candy bars, then he can purchase 10 units of peanut bags.
Table -1 shows the possible quantity of candy bars and peanut bags with the given level of income that is obtained by using equation (1).
Table -1
| Goods/Combination | 1 | 2 | 3 | 4 | 5 | 6 |
| Candy bars | 0 | 4 | 8 | 12 | 16 | 20 |
| Bags of peanuts | 10 | 8 | 6 | 4 | 2 | 0 |
Concept introduction:
Budget constraint: Budget constraints define the possible bundles of services and commodities that are purchased at a given price level with the entire income.
Sub part b:
The possible combination of consumption of two goods.
Sub part b:
Explanation of Solution
The diagram below shows the possible combination of two goods that can be purchased with the limited income. It is drawn based on the values given in the Table -1.
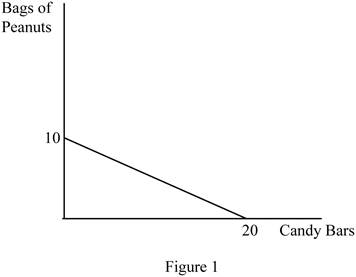
In Figure 1, the horizontal axis measures the quantity of candy bars and the vertical axis measures the quantity of peanut bags. The downward slope indicates the budget line.
The slope can be calculated as follows.
Thus, the slope of this budget line is -0.5.
Opportunity cost (OP) of obtaining one more candy bar can be calculated as follows.
In the calculation of opportunity cost, the sign can be ignored. Thus, the opportunity cost of getting one more candy bar is 0.5.
The opportunity cost (OP) of obtaining one more peanut bag can be calculated as follows.
In the calculation of opportunity cost, the sign can be ignored. The opportunity cost of getting one more candy bar is 2. The opportunity costs are constant over the possible combination of bundles since the slope of the budget line remains the same over different points in the budget line.
Concept introduction:
Budget constraint: Budget constraints define the possible bundles of services and commodities that are purchased at a given price level with the entire income.
Opportunity cost: Opportunity cost refers to the benefits given up in the process of obtaining some other benefit.
Sub part (c):
The possible combination of consumption of two goods.
Sub part (c):
Explanation of Solution
The budget line shows only the possible combination of goods and services that can be purchased simultaneously within the given income level. Thus, it does not determine the optimum quantity of two goods.
Concept introduction:
Budget constraint: Budget constraints define the possible bundles of services and commodities that are purchased at a given price level with the entire income.
Opportunity cost: Opportunity cost refers to the benefits given up in the process of obtaining some other benefit.
Sub part (d):
The possible combination of consumption of two goods.
Sub part (d):
Explanation of Solution
Table -2 shows the possible quantity of candy bars and peanut bags with the increased level of income that is obtained by using equation (1).
Table -2
| Goods/ Combination | 1 | 2 |
| Candy bars | 0 | 40 |
| Bags of peanuts | 20 | 0 |
The diagram below shows the possible combination of two goods that can be purchased with a limited income. It is drawn based on the values given in Table -2.
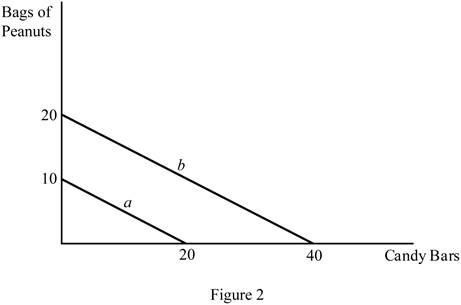
In Figure 2, the horizontal axis measures the quantity of the candy bar and the vertical axis measures the peanut bags. The downward slope (a) indicates the budget line with a $15 income, and the downward slope (b) indicates the budget line with a $30 income. Increasing the level of the income shifts the budget line to the right side.
Concept introduction:
Budget constraint: Budget constraints define the possible bundles of services and commodities that are purchased at a given price level with the entire income.
Opportunity cost: Opportunity cost refers to the benefits given up in the process of obtaining some other benefit.
Want to see more full solutions like this?
Chapter 1 Solutions
Macroeconomics 20th Edition

- If a family spends its entire budget in a given time frame, the family can afford either 95 cans of vegetables or 40 frozen dinners. Assuming the family spends its entire budget on just these two goods, what is the opportunity cost of a can of vegetables in the time frame?arrow_forwardMarie has a weekly budget of $24, which she likes to spend on magazines and pies. If the price of a magazine is $4 each, what is the maximum number of magazines she could buy in a week? If the price of a pie is $12, what is the maximum number of pies she could buy in a week? What is Marie’s opportunity cost of purchasing a pie? At the start of the week, Marie decides to buy a pie. Does this imply that the utility she receives from this pie is greater than or less than her opportunity cost of purchasing the pie? Marie is thinking about purchasing a second pie. Do we expect the marginal utility she receives from the second pie to be greater than, less than, or equal to the marginal utility she receives from the first pie? Explain your answer.arrow_forwardHow does the slope of a budget line illustrate opportunity costs and trade-offs? How does a budget line illustrate scarcity and the effect of limited incomes?arrow_forward
- Suppose you won $15 on a lotto ticket at the local 7-Eleven and decided to spend all the winnings on candy bars and bags of peanuts. The price of candy bars is $.75 and the price of peanuts is $1.50. Suppose that you had won $30 on your ticket, not $15. Show the $30 budget line in your diagram. Why would this budget line be preferable to the old one?arrow_forwardExplain why individuals make choices that are directly on the budget constraint, rather than inside the budget constraint or outside it.arrow_forwardAccording to the principle of , consumers determine what is produced in the economy through their purchasing decisions.arrow_forward
- 1. Suppose you earn $1500 per week and you consume only two types of goods per week- sandwiches and orange juice, which you purchase at a mini mart. Each sandwich cost $150 and an orange juice is $75 per cup. a) Construct a table showing the alternative combinations of the two products that are available. b)Plot the data in your table on a budget line. What is the slope of the budget line? What is the opportunity cost of one more cup of orange juice? And what is opportunity cost of one more sandwich? Do these opportunity cost rise, fall or remain constant as you purchase an additional unit of the product? c)Suppose the price of a cup of orange juice increased to $150. Construct a new table showing alternative combinations of sandwiches and orange juice. Construct the new budget line.arrow_forwardDraw a production possibilities curve for food and clothing. If you are operating on the curve, what is the opportunity cost of producing more clothing? If you are on the curve, is it possible to increase production of one good without decreasing the production of the other?arrow_forward1. Suppose you won $15 on a lotto ticket at the local 7-Eleven and decided to spend all the winnings on candy bars and bags of peanuts. The price of candy bars is $.75 and the price of peanuts is $1.50. a. Construct a table showing the alternative combinations of the two products that are available.b. Plot the data in your table as a “budget” line in a graph. What is the slope of the “budget” line? What is the opportunity cost of one more candy bar? Of one more bag of peanuts?arrow_forward
- Q15.) Answer each question. Marie has a weekly budget of $24, which she likes to spend on magazines and pies. The price of a pie is $12 1.) If the price of a magazine is $4 each, the maximum number of magazines she could buy in a week is ___. 2.) If she buys 1 pie the number of magazines she can buy in a week is ____. 3.) What is her S opportunity cost of purchasing a pie? ___ 4.) If Marie's weekly budget is $24, which she likes to spend on magazines and pies, and If the price of a pie is $12 each, what is the maximum number of pies she could buy in a week? ___arrow_forwardSuppose that you are given a $100 budget at work that can be spent only on two items: staplers and pens. If staplers cost $10 each and pens cost $2.50 each, then the opportunity cost of purchasing one stapler is: a. 10 pens. b. 5 pens. c. zero pens. d. 4 pens.arrow_forwardMICROECONOMICS Clara is leaving for the university restaurant with 3000 HUF in her pocket. Clara is only interested in two things; grilled chicken (x) and salad (y). One slice of grilled chicken costs 300 HUF and the price of 100 grams of salad is 500 HUF. What is the slope of Clara's budget line assuming that she spends her entire budget on these two items and she measures her consumption of grilled chicken on the horizontal axis and salad on the vertical one? (Please use two decimals in your answer.)arrow_forward


 Economics (MindTap Course List)EconomicsISBN:9781337617383Author:Roger A. ArnoldPublisher:Cengage Learning