
Sub part (a):
The possible combination of consumption of two goods.
Sub part (a):
Explanation of Solution
The consumption bundle of two goods can be calculated by using the following formula.
Substitute the respective values in equation (1) to calculate the number of peanut bags purchased while consuming 0 units of candy bars.
When the person consumes 0 quantities of candy bars, then he can purchase 10 units of peanut bags.
Table -1 shows the possible quantity of candy bars and peanut bags with the given level of income that is obtained by using equation (1).
Table -1
| Goods/Combination | 1 | 2 | 3 | 4 | 5 | 6 |
| Candy bars | 0 | 4 | 8 | 12 | 16 | 20 |
| Bags of peanuts | 10 | 8 | 6 | 4 | 2 | 0 |
Concept introduction:
Budget constraint: Budget constraints define the possible bundles of services and commodities that are purchased at a given price level with the entire income.
Sub part b:
The possible combination of consumption of two goods.
Sub part b:
Explanation of Solution
The diagram below shows the possible combination of two goods that can be purchased with the limited income. It is drawn based on the values given in the Table -1.
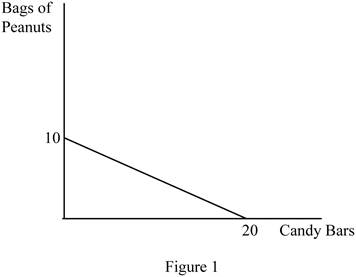
In Figure 1, the horizontal axis measures the quantity of candy bars and the vertical axis measures the quantity of peanut bags. The downward slope indicates the budget line.
The slope can be calculated as follows.
Thus, the slope of this budget line is -0.5.
Opportunity cost (OP) of obtaining one more candy bar can be calculated as follows.
In the calculation of opportunity cost, the sign can be ignored. Thus, the opportunity cost of getting one more candy bar is 0.5.
The opportunity cost (OP) of obtaining one more peanut bag can be calculated as follows.
In the calculation of opportunity cost, the sign can be ignored. The opportunity cost of getting one more candy bar is 2. The opportunity costs are constant over the possible combination of bundles since the slope of the budget line remains the same over different points in the budget line.
Concept introduction:
Budget constraint: Budget constraints define the possible bundles of services and commodities that are purchased at a given price level with the entire income.
Opportunity cost: Opportunity cost refers to the benefits given up in the process of obtaining some other benefit.
Sub part (c):
The possible combination of consumption of two goods.
Sub part (c):
Explanation of Solution
The budget line shows only the possible combination of goods and services that can be purchased simultaneously within the given income level. Thus, it does not determine the optimum quantity of two goods.
Concept introduction:
Budget constraint: Budget constraints define the possible bundles of services and commodities that are purchased at a given price level with the entire income.
Opportunity cost: Opportunity cost refers to the benefits given up in the process of obtaining some other benefit.
Sub part (d):
The possible combination of consumption of two goods.
Sub part (d):
Explanation of Solution
Table -2 shows the possible quantity of candy bars and peanut bags with the increased level of income that is obtained by using equation (1).
Table -2
| Goods/ Combination | 1 | 2 |
| Candy bars | 0 | 40 |
| Bags of peanuts | 20 | 0 |
The diagram below shows the possible combination of two goods that can be purchased with a limited income. It is drawn based on the values given in Table -2.
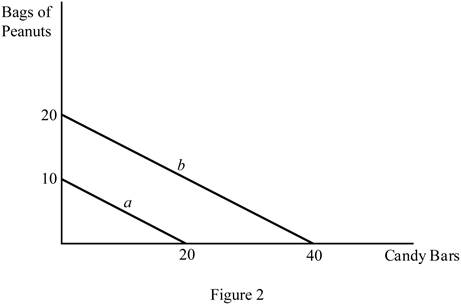
In Figure 2, the horizontal axis measures the quantity of the candy bar and the vertical axis measures the peanut bags. The downward slope (a) indicates the budget line with a $15 income, and the downward slope (b) indicates the budget line with a $30 income. Increasing the level of the income shifts the budget line to the right side.
Concept introduction:
Budget constraint: Budget constraints define the possible bundles of services and commodities that are purchased at a given price level with the entire income.
Opportunity cost: Opportunity cost refers to the benefits given up in the process of obtaining some other benefit.
Want to see more full solutions like this?
Chapter 1 Solutions
MICROECONOMICS (LL) W/ACCESS

- What is the direction of slope indicated by thefollowing examples? [LO A.3]a. As the price of rice increases, consumerswant less of it.b. As the temperature increases, the amount ofpeople who use the town pool also increases.c. As farmers use more fertilizer, their output oftomatoes increases.arrow_forwardEach statement below is part of an economicmodel. Indicate whether the statement is a prediction of cause and effect or an assumption. [LO 1.6]a. People behave rationally.b. If the price of a good falls, people will consume more of that good.arrow_forwardSuppose a typical American consumer purchases three goods, creatively named good A good B. and good The prices of these goods are listed in Table 8P-2. [LO 8.1 aIf the typical consumer purchases two units of each good, what was the percentage increase in the price paid by the consumer for this basket between 2015 and 2016? b If the typical consumer purchases 10 units of good B and 2 units of both good A and good C what was the percentage increase in the price paid by the consumer for this basket? c. Given your answers to parts a and b what is the relationship between the market basket and the nements price change ?arrow_forward
- A consumer has $300 to spend on goods X and Y. The market prices of these two goodsare Px = $15 and Py = $5. (LO2)a. What is the market rate of substitution between goods X and Y?arrow_forwardFor each of the pairs below, determine whetherthey are positively correlated, negatively correlated, or uncorrelated. [LO 1.5]a. Time spent studying and test scoresb. Vaccination and illnessc. Soft drink preference and music preferenced. Income and educationarrow_forwardJohn likes Coca-Cola. After consuming one Coke, John has a total utility of 10 utils. After two Cokes, he has a total utility of 25 utils. After three Cokes, he has a total utility of 50 utils. Does John show diminishing marginal utility for Coke, or does he show increasing marginal utility for Coke? Supposethat John has $3 in his pocket. If Cokes cost $1 each and John is willing to spend one of his dollars on purchasing a first can of Coke, would he spend his second dollar on a Coke, too? What about the third dollar? If John’s marginal utility for Coke keeps on increasing no matter how many Cokes he drinks, would it be fair to say that he is addicted to Coke?arrow_forward
- Antonio buys five new college textbooks during his first year at school at a cost of $80 each. Used books cost only $50 each. When the bookstore announces that there will be a 50 percent increase in the price of new books and a 50 percent increase in the price of used books, Antonio's father offers him $200 extra. What happens to Antonio's budget line? 1.) Using the line drawing tool, graph Antonio's original budget line. Label this line L1. 2.) Using the line drawing tool, then graph Antonio's new budget line. Label this line L2. Carefully follow the instructions above, and only draw the required objects.arrow_forwardRefer to Table 11W.1 and suppose the price of new product C is $2 instead of $4. How does this affect the optimal combination of products A, B, and C for the person represented by the data? Explain: “The success of a new product depends not only on its marginal utility but also on its price.”arrow_forwardTitle Suppose that Lynn enjoys coconut oil in her coffee. She has very particular preferences, and she mus Description Suppose that Lynn enjoys coconut oil in her coffee. She has very particular preferences, and she must have exactly two spoonfuls of coconut oil for each cup of coffee. Let C be the number of cups of coffee, and O be the number of spoonfuls of coconut oil. Also, let PC be the price of a cup of coffee. Suppose Lynn has $12 to spend on coffee and coconut oil. Also, the price of coconut oil is $.50 per spoonful.a) Graph Lynnâs Price Consumption Curve for prices, PC = $1, PC = $2, and PC = $3. Please put the number of cups of coffee on the horizontal axis, and the number of spoonfuls of coconut oil on the vertical axis. Be sure to label your graph carefully and accurately.b) Graph Lynnâs demand curve for coffee. You may assume that both coconut oil and coffee are continuous variables so she can consume any amount of coffee and coconut oil that she could afford.…arrow_forward
- A consumer’s budget set for two goods (X and Y) is 600 ≥ 3X + 6Y. (LO2) a. Illustrate the budget set in a diagram. b. Does the budget set change if the prices of both goods double and the consumer’s income also doubles? Explain. c. Given the equation for the budget set, can you determine the prices of the two goods? The consumer’s income? Explain.arrow_forwardQ1 please help me quickly!! Your budget is $200. The price of good 1 (x1) is $4 per unit, and that of good 2 (x2) is $3 per unit. Then, the equation for your budget line can be written as O 5x1 + 3x2 = 200 ◎ 4x1 + 3x2 = 200 ◎ 4x1+ 4x2 = 200 O 5x1 + 3×2 = 195arrow_forwardSuppose that Omar’s marginal utility for cups of coffee is constant at 1.5 utils per cup no matter how many cups he drinks. On the other hand, his marginal utility per doughnut is 10 for the first doughnut he eats, 9 for the second he eats, 8 for the third he eats, and so on (that is, declining by 1 util per additional doughnut). In addition, suppose that coffee costs $1 per cup, doughnuts cost $1 each, and Omar has a budget that he can spend only on doughnuts, coffee, or both. How big would that budget have to be before he would spend a dollar buying a first cup of coffee?arrow_forward

