Financial and Managerial Accounting - Workingpapers
15th Edition
ISBN: 9781337912112
Author: WARREN
Publisher: CENGAGE L
expand_more
expand_more
format_list_bulleted
Concept explainers
Videos
Textbook Question
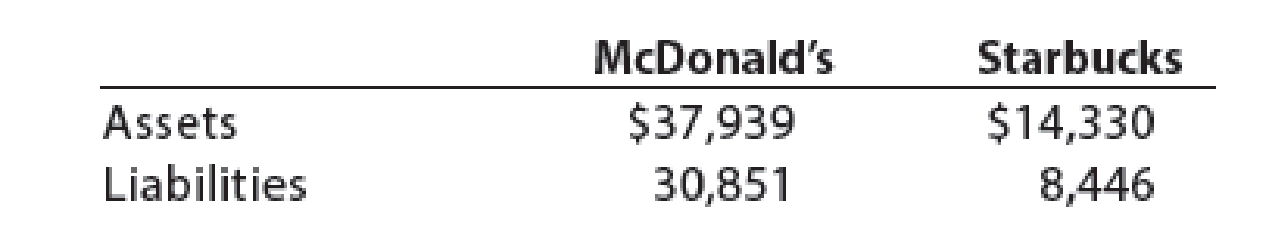
Chapter 1, Problem 4E
The total assets and total liabilities (in millions) of McDonald’s Corporation (MCD) and Star-bucks Corporation (SBUX) follow:
Expert Solution & Answer

Trending nowThis is a popular solution!

Students have asked these similar questions
Attached below is the Balance Sheet of GoodWorld Incorporated Company. Calculate
the WACC for the company by using the capital Structure value from the balance
sheet.
Use the format below to answer your question.
Capital Structure
1.Common Stock
2.Preferred Stock
3.Loans / LT debt /Bond
4.Retained Earnings
Total
ASSETS
Current Assets
Cash and Cash Equivalents
Accounts Receivable
Inventory
Prepaid Expenses
Investment
Total Current Assets
Amount in Balance Sheet
Calculate the WACC:
Balance Sheet of GoodWorld Incorporated Company
Good World Incorporated
Balance Sheet
31-Dec-22
Property & Equipment
Land
Buildings
Equipment
Less: Accumulated Depreciation
Other Assets
Intangible Assets
Less: Accumulated Amortization
Total Assets
$'000
200,000
30,000
20,000
10,000
20,000
280,000
120,000
450,000
100,000
-30,000
40,000
-10,000
Cost
950,000
12%
10%
14%
12%
Proposition
LIABILITIES & SHAREHOLDERS EQUITY
Current Liabilities
Accounts Payable
Notes Payables
Accrued Expenses
Deferred Revenue
Total…
The following data were taken from the Statement of Affairs of Greenfield Corporation:
What is the estimated amount holders of the accounts payable will receive upon?
We are given the following information for Pettit Corporation.
Sales (credit)
Cash
Inventory
Current liabilities
Asset turnover
Current ratio
Debt-to-assets ratio
Receivables turnover
$2,068,000
150,000
923,000
763,000
a. Accounts receivable
b. Marketable securities
c. Capital assets.
d. Long-term debt
$
Current assets are composed of cash, marketable securities, accounts receivable, and inventory.
Calculate the following balance sheet items:
LA LA LA
$
$
1.00 times
2.60 times
$
40 %
4 times
517000
Chapter 1 Solutions
Financial and Managerial Accounting - Workingpapers
Ch. 1 - Prob. 1DQCh. 1 - Prob. 2DQCh. 1 - Prob. 3DQCh. 1 - Josh Reilly is the owner of Dispatch Delivery...Ch. 1 - On July 12, Reliable Repair Service extended an...Ch. 1 - Prob. 6DQCh. 1 - Describe the difference between an account...Ch. 1 - A business had revenues of 679,000 and operating...Ch. 1 - A business had revenues of 640,000 and operating...Ch. 1 - The financial statements are interrelated. (A)...
Ch. 1 - Prob. 1BECh. 1 - Accounting equation Be-The-One is a motivational...Ch. 1 - Transactions Interstate Delivery Service is owned...Ch. 1 - Income statement The revenues and expenses of...Ch. 1 - Statement of stockholders equity Using the income...Ch. 1 - Balance sheet Using the following data for...Ch. 1 - Statement of cash flows A summary of cash flows...Ch. 1 - Ratio of liabilities to stockholders equity The...Ch. 1 - Prob. 1ECh. 1 - Prob. 2ECh. 1 - Prob. 3ECh. 1 - Accounting equation The total assets and total...Ch. 1 - Prob. 5ECh. 1 - Accounting equation Determine the missing amount...Ch. 1 - Accounting equation Inspirational Inc. is a...Ch. 1 - Asset, liability, and stockholders equity items...Ch. 1 - Effect of transactions on accounting equation What...Ch. 1 - Effect of transactions on accounting equation A. A...Ch. 1 - Effect of transactions on stockholders equity...Ch. 1 - Transactions The following selected transactions...Ch. 1 - Nature of transactions Teri West operates her own...Ch. 1 - Net income and dividends The income statement for...Ch. 1 - Net income and stockholders equity for four...Ch. 1 - Balance sheet items From the following list of...Ch. 1 - Income statement items Based on the data presented...Ch. 1 - Statement of stockholders equity Financial...Ch. 1 - Income statement Imaging Services was organized on...Ch. 1 - Prob. 20ECh. 1 - Balance sheets, net income Financial information...Ch. 1 - Financial statements Each of the following items...Ch. 1 - Statement of cash flows Indicate whether each of...Ch. 1 - Statement of cash flows A summary of cash flows...Ch. 1 - Financial statements We-Sell Realty was organized...Ch. 1 - Transactions On April 1 of the current year,...Ch. 1 - Financial statements The assets and liabilities of...Ch. 1 - Financial statements Seth Feye established...Ch. 1 - Transactions; financial statements On August 1,...Ch. 1 - Transactions; financial statements DLite Dry...Ch. 1 - Missing amounts from financial statements The...Ch. 1 - Transactions Amy Austin established an insurance...Ch. 1 - PR 1-2 B Financial statements The assets and...Ch. 1 - Financial statements 1. Net income: 10,900 Jose...Ch. 1 - Transactions; financial statements 2. Net income:...Ch. 1 - Transactions; financial statements Bevs Dry...Ch. 1 - Missing amounts from financial statements The...Ch. 1 - Peyton Smith enjoys listening to all types of...Ch. 1 - Prob. 1MADCh. 1 - Analyze The Home Depot for three years The Home...Ch. 1 - Analyze Lowes for three years Lowes Companies,...Ch. 1 - Compare The Home Depot and Lowes Using your...Ch. 1 - Compare Papa Johns and Yum! Brands The following...Ch. 1 - Prob. 1TIFCh. 1 - Prob. 2TIFCh. 1 - Prob. 4TIFCh. 1 - Prob. 5TIFCh. 1 - Prob. 6TIF
Knowledge Booster


Learn more about
Need a deep-dive on the concept behind this application? Look no further. Learn more about this topic, accounting and related others by exploring similar questions and additional content below.Similar questions
- The total assets and total liabilities (in millions) of Dollar Tree Inc. and Target Corporation follow: Determine the owners equity of each company.arrow_forwardIllies Corporation's comparative balance sheet appears below: Beginning Balance Assets: Current assets Cash and cash equivalents. Accounts receivable. Inventory. Total current assets Property, plant, and equipment. Less accumulated depreciation. Net property, plant, and equipment. Total assets. Liabilities and Stockholders' Equity Current liabilities: Accounts payable. Accrued wages and salaries payable.. Accrued income taxes payable. Notes payable. Total current liabilities. Long-term debt. Deferred income taxes. Total liabilities Stockholders' equity: Common stock. Retained earnings. Ending Balance Select one: $ 40,000 19,000 O a. $7,000 O b. $40,000 O c. $29,000 O d. $33,000 67,000 126,000 123,000 358,000 339,000 156,000 132,000 202.000 $328,000 $ 33,000 21,000 69,000 $ 18,000 35,000 23,000 207.000 $330,000 23,000 103,000 22,000 102,000 Total stockholders' equity 126,000 124.000 Total liabilities and stockholders' equity.... $328,000 $330.000 $ 19,000 37,000 19,000 19,000 22,000…arrow_forwardFinancial statements for Allendale Company follow: Assets Current assets Cash Marketable securities Accounts receivable (net) Inventories Prepaid items Total current assets. Investments Plant (net) Land Total assets Liabilities and Stockholders' Equity Liabilities Current liabilities Notes payable Accounts payable Salaries payable Total current liabilities Noncurrent liabilities Bonds payable Other Total noncurrent liabilities Total liabilities Stockholders' equity Preferred stock, (par value $10, 4% cumulative, non-participating; 8,000 shares authorized and issued) Common stock (no par; 50,000 shares authorized; 10,000 shares issued) Retained earnings. Total stockholders' equity Total liabilities and stockholders' equity ALLENDALE COMPANY Statements of Income and Retained Earnings. For the Years Ended December 31 Year 4 Year 3 Revenues $230,000 8,000 $210,000 5,000 238,000 215,000 120,000 103,000 55,000 50,000 8,000 7,200 23,000 22,000 206,000 182,200 32,000 32,800 132,000 107,000…arrow_forward
- What's the total asset turnover ratio of this company? Assets: Cash and marketable securities Accounts receivable Inventories Prepaid expenses Total current assets Fixed assets Less: accum. depr. Net fixed assets Total assets Liabilities: Accounts payable Notes payable Accrued taxes Total current liabilities Long-term debt Owner's equity (1 million shares of common stock outstanding) Total liabilities and owner's equity Net sales (all credit) Less: Cost of goods sold Selling and administrative expense Depreciation expense Interest expense Earnings before taxes Income taxes Net income 1.41 2.33 O 4.45 1.11 8,000,000 (2,075,000) $600,000 900,000 1,500,000 75,000 $3,075,000 $5,925.000 $9,000,000 $800,000 700,000 50,000 $1,550,000 2,500,000 4,950,000 $9,000,000 $10,000,000 (3,000,000) (2,000,000) (250,000) (200,000) 4,550,000 (1,820,000) $2,730,000arrow_forwardHirshberg Corporation's comparative balance sheet appears below: Comparative Balance Sheet Assets: Current assets: Cash and cash equivalents Accounts receivable Inventory Total current assets Property, plant, and equipment Less accumulated depreciation Net property, plant, and equipment. Total assets Liabilities and stockholders' equity: Current liabilities: Accounts payable Accrued liabilities Income taxes payable Total current liabilities. Bonds payable Total liabilities Stockholders' equity: Common stock Retained earnings. Total stockholders' equity Total liabilities and stockholders' equity. The company's net cash provided by (used in) investing activities is: Multiple Choice O $41,000 $38,300 O $(9,000) O Ending Balance $(23,000) $ 63,000 36,700 79,300 179,000 362,000 208,000 154,000 $333,000 The company's net income for the year was $14,700 and its cash dividends were $7,100. It did not sell or retire any property, plant, and equipment during the year. $ 39,300 84, 100 67,300…arrow_forwardWhat is the Days Payables Outstanding? Use the attached financial data to calculate the ratios. Round to the nearest decimal. Abercrombie & Fitch Co (ANF) Financial Data Revenues Cost of Sales Total Operating Expenses Interest Expense Income Tax Expense Diluted Weighted Shares Outstanding Cash + Equivalents Accounts Receivable Inventories Total Current Assets Total Assets Accounts Payable Total Current Liabilities Total Stockholders' Equity ANF Stock Price = $10.30 Select one O A. 42.3 days, 37.0 days OB. 76.1 days, 89.4 days OC. 89.4 days, 37.0 days OD. 76.1 days, 97.7 days 2022 $3,659.3 $1,545.9 $2,026.9 $28.5 $37.8 52.8 $257.3 $108.5 $742.0 $1,220.4 $2,694.0 $322.1 $935.5 $656.1 2021 $3,712.8 $1,400.8 $1,968.9 $34.1 $38.9 62.6 $823.1 $69.1 $525.9 $1,507.8 $2,939.5 $374.8 $1,015.2 $826.1arrow_forward
- Financial statements for Rundle Company follow. Assets Current assets Cash Marketable securities Accounts receivable (net) Inventories Prepaid items Total current assets Investments Plant (net) Land Total assets Liabilities and Stockholders' Equity Liabilities Current liabilities Notes payable Accounts payable Salaries payable Total current liabilities Noncurrent liabilities Bonds payable Other Total noncurrent liabilities. Total liabilities Stockholders' equity. Preferred stock, (par value $10, 4% cumulative, non-participating; 7,000 shares authorized and issued) Common stock (no par; 50,000 shares authorized; 10,000 shares issued) Retained earnings Total stockholders' equity Total liabilities and stockholders' equity Revenues Sales (net) Other revenues RUNDLE COMPANY Statements of Income and Retained Earnings For the Years Ended December 31 Total revenues Expenses Cost of goods sold RUNDLE COMPANY Balance Sheets As of December 31 Selling, general, and administrative Interest expense…arrow_forwardMarbry Corporation's balance sheet and income statement appear below: Comparative Balance Sheet Assets: Current assets: Cash and cash equivalents Accounts receivable Inventory Total current assets Property, plant, and equipment Less accumulated depreciation Net property, plant, and equipment Total assets Liabilities and stockholders' equity: Current liabilities: Accounts payable Accrued liabilities Income taxes payable Total current liabilities Bonds payable Total liabilities Stockholders' equity: Common stock Retained earnings Total stockholders' equity Total liabilities and stockholders' equity Income Statement Sales Cost of goods sold Gross margin Selling and administrative expense Net operating income Gain on sale of plant and equipment Income before taxes Income taxes Net income $ 705 403 302 222 80 11 91 35 $ 56 Ending Balance $ 38 49 58 145 460 258 202 $ 347 $ 51 24 47 122 97 219 42 86 128 $ 347 Beginning Balance $ 33 52 52 137 420 252 168 $ 305 $ 47 18 47 112 124 236 32 37 69 $…arrow_forwardData from the financial statements of Naranjo Co. and Jablonsky, Inc. are presented below (in millions): Naranjo Co. Total liabilities, Year 20 Total liabilities, Year 1 Total assets, Year 2 Total assets, Year 1 Net Sales, Year 2 Net income, Year 2 Select one: O O $70,914 72,208 100,372 94,114 306,932 280 To the nearest hundredth, what is the Year 2 debt-to-total assets ratio for Jablonsky, Inc.? A. 0.21 B. 0.64 C. 4.96 D. 4.69 Jablonsky, Inc. $47,422 60,092 73,744 70,416 163,040 1,572arrow_forward
- Autry Corporation's balance sheet and income statement appear below: Assets: Current assets: Cash and cash equivalents Accounts receivable Inventory Total current assets Property, plant, and equipment Less accumulated depreciation Net property, plant, and equipment Total assets Comparative Balance Sheet Liabilities and stockholders' equity: Current liabilities: Accounts payable Accrued liabilities Income taxes payable Total current liabilities Bonds payable Total liabilities Stockholders' equity: Common stock Retained earnings Total stockholders' equity Total liabilities and stockholders' equity Income Statement Sales Cost of goods sold Gross margin Selling and administrative expense Net operating income $ 870 511 359 136 223 Ending Balance $ 46 79 58 183 652 251 401 $ 584 $ 53 30 58 141 81 222 56 306 362 $ 584 Beginning Balance $ 47 78 56 181 535 284 251 $ 432 $ 57 29 62 148 75 223 55 154 209 $ 432arrow_forwardCompute the debt ratio from the data shown below: Balance Sheet (Millions of $) Assets Cash and securities Accounts receivable Inventories Total current assets Net plant and equipment Total assets Liabilities and Equity Accounts payable Notes payable Accruals Total current liabilities Long-term bonds Total debt Common stock Retained earnings Total common equity Total liabilities and equity Income Statement (Millions of $) Net sales Operating costs except depreciation Depreciation Earnings bef interest and taxes (EBIT) 2007 $1,290 9,890 13,760 $24,940 $18,060 $43.000 $8,170 6,020 4.730 $18,920 $8,815 $27.735 $5,805 2.460 $15.265 $43,000 2007 $51.600 48,246 903 $2,451 Karrow_forwardWhat do the following ratios reveal about the financial health of a company? And how do I calculate them? Liquidity of Short-term Assets Current Ratio Cash Ratio Quick Ratioarrow_forward
arrow_back_ios
SEE MORE QUESTIONS
arrow_forward_ios
Recommended textbooks for you
 Financial And Managerial AccountingAccountingISBN:9781337902663Author:WARREN, Carl S.Publisher:Cengage Learning,
 Financial AccountingAccountingISBN:9781337272124Author:Carl Warren, James M. Reeve, Jonathan DuchacPublisher:Cengage Learning
Financial And Managerial Accounting
Accounting
ISBN:9781337902663
Author:WARREN, Carl S.
Publisher:Cengage Learning,
Financial Accounting
Accounting
ISBN:9781337272124
Author:Carl Warren, James M. Reeve, Jonathan Duchac
Publisher:Cengage Learning
The ACCOUNTING EQUATION For BEGINNERS; Author: Accounting Stuff;https://www.youtube.com/watch?v=56xscQ4viWE;License: Standard Youtube License