Videos
(a)
Whether
(b)
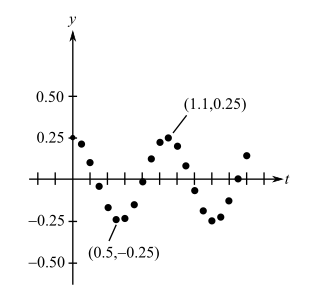
To calculate: The amplitude and the period of oscillations for the weight suspended by the spring if the data recorded by the motion detector is as shown below:
(c)
The model for the provided data:
Where,
(d)
To graph: The model
Want to see the full answer?
Check out a sample textbook solution
Chapter 1 Solutions
Calculus: Early Transcendental Functions (MindTap Course List)


- Oscillation of a Spring A ball that is bobbing up and down on the end of a spring has a maximum displacement of 3 inches. Its motion (in ideal conditions) is modeled by y=14cos16t,t0, where y is measured in feet and t is the time in seconds. (a) Graph the function. (b) What is the period of the oscillations? (c) Determine the first time the weight passes the point of equilibrium y=0.arrow_forwardSimple Harmonic Motion A mass suspended from a spring oscillates in simple harmonic motion at a frequency of 4 cycles per second. The distance from the highest to the lowest point of the oscillation is 100 cm. Find an equation that describes the distance of the mass from its rest position as a function of time. Assume that the mass is at its lowest point when t=0.arrow_forwardPhysics Experiment Consider a physics laboratory experiment designed to determine an unknown mass. A flexible metal meter stick is clamped to a table with 50 centimeters overhanging the edge (see figure). Known masses Mranging from 200grams to 2000grams are attached to the end of the meter stick. For each mass, the meter stick is displaced vertically and then allowed to oscillate. The average time t(in seconds) of one oscillation for each mass is recorded in the table. A model for the data that can be used to predict the time of one oscillation is t=38M+16,96510(M+5000). (a) Use this model to create a table showing the predicted time for each of the masses shown in the table above. (b) Compare the predicted times with the experimental times. What can you conclude? (c) Use the model to approximate the mass of an object for which t=1.056seconds.arrow_forward
- Salmon Survival For reasons that are not yet fully understood, the number of fingerling salmon that survive the trip from their riverbed spawning grounds to the open ocean varies approximately sinusoidally from year to year. The table shows the number of salmon that hatch in a certain British Columbia creek and then make their way to the Strait of Georgia. The data are given in thousands of fingerlings, over a period of 16 years. a Make a scatter plot of the data. b Find a sine curve that models the data as in Example 1. c Graph the function you found in part b together with the scatter plot. d Use a graphing calculator to find the sine curve that best fits the data as in Example 2. Compare to your answer from part b. Year Salmon 1000 Year Salmon 1000 1985 43 1993 56 1986 36 1994 63 1987 27 1995 57 1988 23 1996 50 1989 26 1997 44 1990 33 1998 38 1991 43 1999 30 1992 50 2000 22arrow_forwardAn object is moving up and down in damped harmonic motion. Its displacement at time t=0 is 16 in.; this is its maximum displacement. The damping constant is c=0.1, and the frequency is 12 Hz. a Find a function that models this motion. b Graph the function.arrow_forwardFuel Consumption The daily consumption C (in gallons) of diesel fuel on a farm is modeled by C=30.3+21.6sin2t365+10.9 where t is the time (in days), with t=1 corresponding to January 1. (a) What is the period of the model? Is it what you expected? Explain. (b) What is the average daily fuel consumption? Which value in the model did you use? Explain. (c) Use a graphing utility to graph the model. Use the graph to approximate the time of the year when consumption exceeds 40 gallons per day.arrow_forward
 Trigonometry (MindTap Course List)TrigonometryISBN:9781337278461Author:Ron LarsonPublisher:Cengage Learning
 Algebra and Trigonometry (MindTap Course List)AlgebraISBN:9781305071742Author:James Stewart, Lothar Redlin, Saleem WatsonPublisher:Cengage Learning
 Algebra & Trigonometry with Analytic GeometryAlgebraISBN:9781133382119Author:SwokowskiPublisher:Cengage
 College AlgebraAlgebraISBN:9781305115545Author:James Stewart, Lothar Redlin, Saleem WatsonPublisher:Cengage Learning