Concept explainers
Videos
(a)
The liner and cubic model by the use of regression capabilities of graphing utility of the data,
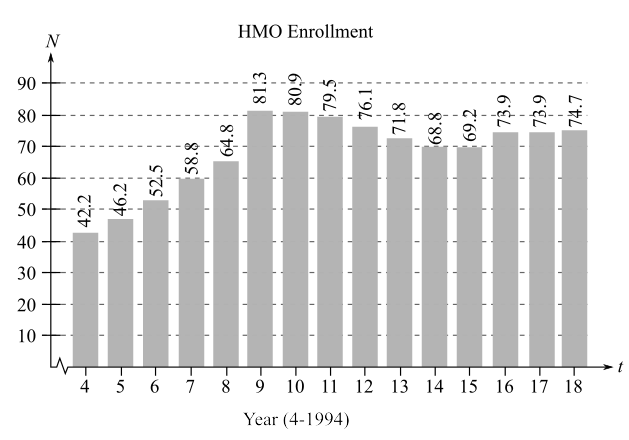
Where t be the time in the year with
(b)
To graph: The linear model
(c)
Whether the cubic model
(d)
The quadratic model by the use of regression capabilities of graphing utility of the data,
Also, graph the quadratic model and find how well the model fits the data.
(e)
The number of people receiving care in HMOs in the year 2014 by the use of linear model
(f)
The quartic model by the use of regression capabilities of graphing utility of the data,
Also, find which model fits the data well.
Want to see the full answer?
Check out a sample textbook solution
Chapter 1 Solutions
Calculus: Early Transcendental Functions (MindTap Course List)


- Life Expectancy The average life expectancy in the United States has been rising steadily over the past few decades, as shown in the table. (a) Make a scatter plot of the data. (b) Find and graph the regression line. (c) Use the linear model you found in part (b) to predict the life expectancy in the year 2006. (d) Search the Internet or your campus library to find the actual 2006 average life expectancy. Compare to your answer in part (c).arrow_forwardDemand for Candy Bars In this problem you will determine a linear demand equation that describes the demand for candy bars in your class. Survey your classmates to determine what price they would be willing to pay for a candy bar. Your survey form might look like the sample to the left. a Make a table of the number of respondents who answered yes at each price level. b Make a scatter plot of your data. c Find and graph the regression line y=mp+b, which gives the number of respondents y who would buy a candy bar if the price were p cents. This is the demand equation. Why is the slope m negative? d What is the p-intercept of the demand equation? What does this intercept tell you about pricing candy bars? Would you buy a candy bar from the vending machine in the hallway if the price is as indicated. Price Yes or No 50 75 1.00 1.25 1.50 1.75 2.00arrow_forwardCellular Phone Subscribers The table shows the numbers of cellular phone subscribers y in millions in the United States from 2008 through 2013. Source: CTIA- The Wireless Association Year200820092010201120122013Number,y270286296316326336 (a) Find the least squares regression line for the data. Let x represent the year, with x=8 corresponding to 2008. (b) Use the linear regression capabilities of a graphing utility to find a linear model for the data. How does this model compare with the model obtained in part a? (c) Use the linear model to create a table of estimated values for y. Compare the estimated values with the actual data.arrow_forward
 Elementary Linear Algebra (MindTap Course List)AlgebraISBN:9781305658004Author:Ron LarsonPublisher:Cengage Learning
 Algebra and Trigonometry (MindTap Course List)AlgebraISBN:9781305071742Author:James Stewart, Lothar Redlin, Saleem WatsonPublisher:Cengage Learning
 College AlgebraAlgebraISBN:9781305115545Author:James Stewart, Lothar Redlin, Saleem WatsonPublisher:Cengage Learning
 College Algebra (MindTap Course List)AlgebraISBN:9781305652231Author:R. David Gustafson, Jeff HughesPublisher:Cengage Learning
 Glencoe Algebra 1, Student Edition, 9780079039897...AlgebraISBN:9780079039897Author:CarterPublisher:McGraw Hill