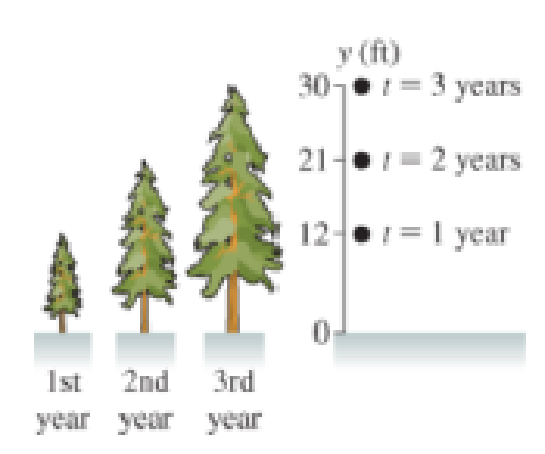
The images of trees in Figure P1.68 come from a catalog advertising fast-growing trees. If we mark the position of the top of the tree in the successive years, as shown in the graph in the figure, we obtain a motion diagram much like ones we have seen for other kinds of motion. The motion isn't steady, of course. In some months the tree grows rapidly; in other months, quite slowly. We can see, though, that the average speed of growth is fairly constant for the first few years. Figure P1.68 69. What is this speed in m/s? A. 9 ×10 −8 m/s B. 3 × 10 −9 m/s C. 5 × 10 −6 m/s D. 2 × 10 −6 m/s
The images of trees in Figure P1.68 come from a catalog advertising fast-growing trees. If we mark the position of the top of the tree in the successive years, as shown in the graph in the figure, we obtain a motion diagram much like ones we have seen for other kinds of motion. The motion isn't steady, of course. In some months the tree grows rapidly; in other months, quite slowly. We can see, though, that the average speed of growth is fairly constant for the first few years. Figure P1.68 69. What is this speed in m/s? A. 9 ×10 −8 m/s B. 3 × 10 −9 m/s C. 5 × 10 −6 m/s D. 2 × 10 −6 m/s
The images of trees in Figure P1.68 come from a catalog advertising fast-growing trees. If we mark the position of the top of the tree in the successive years, as shown in the graph in the figure, we obtain a motion diagram much like ones we have seen for other kinds of motion. The motion isn't steady, of course. In some months the tree grows rapidly; in other months, quite slowly. We can see, though, that the average speed of growth is fairly constant for the first few years.
On a two-leg trip, a car travels the first leg, a distance D1 = 44 miles, in a time t1 = 1.05 hours, and travels the second leg, a distance D2 = 131 miles, in time t2 = 2.2 hours. Refer to the figure.
On a two-leg trip, a car travels the first leg, a distance D1 = 44 miles, in a time t1 = 1.05 hours, and travels the second leg, a distance D2 = 131 miles, in time t2 = 2.2 hours. Refer to the figure.
Part (a) In miles per hour, what is the average speed of the car during the first leg?Numeric : A numeric value is expected and not an expression.vavg1 = __________________________________________Part (b) In miles per hour, what is the average speed of the car during the second leg?Numeric : A numeric value is expected and not an expression.vavg2 = __________________________________________Part (c) In miles per hour, what is the average speed of the car over the entire trip?Numeric : A numeric value is expected and not an…
If the distance dd (in meters) traveled by an object in time tt (in seconds) is given by the formula d=A+Bt2d=A+Bt2, the SI units of AA and BB must be
meters for both AA and BB.
m/sm/s for AA and m/s2m/s2 for BB.
meters for AA and m/s2m/s2 for BB.
m/s2m/s2 for both AA and BB.
In an 8.00 kmkm race, one runner runs at a steady 11.2 km/hkm/h and another runs at 14.9 km/hkm/h.
How far from the finish line is the slower runner when the faster runner finishes the race?
Express your answer in kilometers to three significant figures.
Chapter 1 Solutions
Student Solutions Manual for College Physics: A Strategic Approach Volume 1 (Chs 1-16)
Sears And Zemansky's University Physics With Modern Physics
Knowledge Booster
Learn more about
Need a deep-dive on the concept behind this application? Look no further. Learn more about this topic, physics and related others by exploring similar questions and additional content below.


 Principles of Physics: A Calculus-Based TextPhysicsISBN:9781133104261Author:Raymond A. Serway, John W. JewettPublisher:Cengage Learning
 Physics for Scientists and Engineers with Modern ...PhysicsISBN:9781337553292Author:Raymond A. Serway, John W. JewettPublisher:Cengage Learning
 Physics for Scientists and Engineers: Foundations...PhysicsISBN:9781133939146Author:Katz, Debora M.Publisher:Cengage Learning
 Glencoe Physics: Principles and Problems, Student...PhysicsISBN:9780078807213Author:Paul W. ZitzewitzPublisher:Glencoe/McGraw-Hill
 College PhysicsPhysicsISBN:9781305952300Author:Raymond A. Serway, Chris VuillePublisher:Cengage Learning