
(a)
Interpretation:
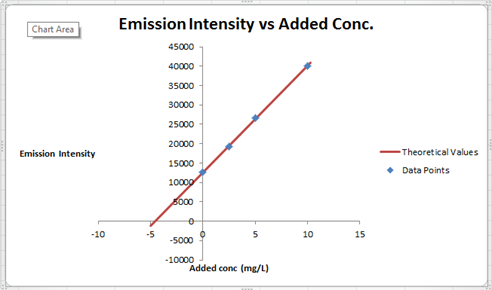
The least square analysis needs to be performed to determine the intercept, slopeand regression statistics, including the standard deviation about regression.
Concept introduction:
The least square analysis is defined as the method in which the final answer for the set of data points is calculated by the minimizing the summation of residue of set of data point from the given curve.
The equation for straight line is represented as follows:
Answer to Problem 10.11QAP
To satisfy the equation
Explanation of Solution
Least Square Analysis

The summary of calculation is as follows.
| Added Au | Emission Intensity (y) | ||
| 0 | 12568 | ||
| 2.5 | 19324 | ||
| 5 | 26622 | ||
| 10 | 40021 | ||
| m | c | 2752.72 | 12590.6 |
| sm | sb | 30.7796445 | 176.3126 |
| r2 | sy | 0.99975001 | 227.6185 |
Here, the sigma values focus on the errors present in the parameter.
So far, we have filled
Now, we must determine the concentration of gold and its uncertainty. The concentration of gold is x. intercept of the graph, because that is the point at which the gold is absence so the difference between that and the zero added point must be the gold concentration in sample.
Now, x is a function of c and m. Thus, the uncertainty in them will be propagated to x as well. We have the following since m and c are independent.
x = x(m,c)
By propagation of uncertainty,
This is, however, the standard error. Assuming the distribution of value to be normal about the value of x, this value would give an interval of 63.5% probability. However, if we want a 95% probability interval, we will have to multiply the error in x by 1.96.
(b)
Interpretation:
The concentration of gold in the sample solution in mg/L needs to be determined using the calculated values.
Concept introduction:
The least square analysis is defined as the method in which the final answer for the set of data points is calculated by the minimizing the summation of residue of set of data point from the given curve.
The equation for straight line is represented as follows:
Answer to Problem 10.11QAP
Concentration of gold in sample =
Explanation of Solution
Least Square Analysis
The summary of calculation is as follows.
| Added Au | Emission Intensity (y) | ||
| 0 | 12568 | ||
| 2.5 | 19324 | ||
| 5 | 26622 | ||
| 10 | 40021 | ||
| m | c | 2752.72 | 12590.6 |
| sm | sb | 30.7796445 | 176.3126 |
| r2 | sy | 0.99975001 | 227.6185 |
Here, the sigma values focus on the errors present in the parameter.
So far, we have filled
Now, we must determine the concentration of gold and its uncertainty. The concentration of gold is x. intercept of the graph, because that is the point at which the gold is absence so the difference between that and the zero added point must be the gold concentration in sample.
Now, x is a function of c and m. Thus, the uncertainty in them will be propagated to x as well. We have the following since m and c are independent.
x = x(m,c)
By propagation of uncertainty,
This is however, the standard error. Assuming the distribution of value to be normal about the value of x, this value would give an interval of 63.5% probability. However, if we want a 95% probability interval, we will have to multiply the error in x by 1.96.
Concentration of gold in sample =
(c)
Interpretation:
The concentration of gold in the sample is 8.51 mg/L needs to be determined and the hypothesis that the results equals the 95% confidence level needs to be tested.
Concept introduction:
The least square analysis is defined as the method in which the final answer for the set of data points is calculated by the minimizing the summation of residue of set of data point from the given curve.
The equation for straight line is represented as follows:
Answer to Problem 10.11QAP
Considering a confidence interval of 95% we have concentration of
Explanation of Solution
Least Square Analysis

The summary of calculation is as follows.
| Added Au | Emission Intensity (y) | ||
| 0 | 12568 | ||
| 2.5 | 19324 | ||
| 5 | 26622 | ||
| 10 | 40021 | ||
| m | c | 2752.72 | 12590.6 |
| sm | sb | 30.7796445 | 176.3126 |
| r2 | sy | 0.99975001 | 227.6185 |
Here, the sigma values focus on the errors present in the parameter.
So far, we have filled
Now, we must determine the concentration of gold and its uncertainty. The concentration of gold is x. intercept of the graph, because that is the point at which the gold is absence so the difference between that and the zero added point must be the gold concentration in sample.
Now, x is a function of c and m. Thus, the uncertainty in them will be propagated to x as well. We have the following since m and c are independent.
x = x(m,c)
By propagation of uncertainty,
This is however, the standard error. Assuming the distribution of value to be normal about the value of x, this value would give an interval of 63.5% probability. However, if we want a 95% probability interval, we will have to multiply the error in x by 1.96.
Considering a confidence interval of 95% we have concentration of
Want to see more full solutions like this?
Chapter 10 Solutions
PRINCIPLES OF INSTRUMENTAL ANALYSIS

- Excess KI is added to a 100.0-mL sample of a soft drink that had been contaminated with bleach, NaClO. The iodine (l2) generated in the solution is then titrated with 0.0425 M Na2S2O3 and requires 25.3 mL to reach the equivalence point. What mass of NaClO was contained in the 100.0-mL sample of adulterated soft drink?arrow_forwardFive white, 500-mg uncoated ascorbic acid (AA) tablets with an average weight of 0.6152-g were pulverized in a mortar. A sample of the powdered ascorbic acid weighing 0.4700-g was placed in an iodine flask and was dissolved in 50-mL H2SO4 then 5-g of KBr was added to the resulting solution. The solution was titrated with 47.81-mL of 0.09640 N STD. KBrO3 to reach a faint yellow endpoint then 3-g KI and 5-mL Starch TS. The blue color solution is then titrated with 2.73-mL of 0.09123 N STD. Na2S2O3 to reach the disappearance of the blue iodostarch complex. MW: KBrO3 = 167.0 ; KIO3 = 214.0 ; Na2S2O3 = 158.11 ; C6H8O6 = 176.12 Compute the milligrams of pure AA per tablet from the assay. 293.3 mg 502.5 mg None of the choices 383.9 mgarrow_forwardFive white, 500-mg uncoated ascorbic acid (AA) tablets with an average weight of 0.6100-g were pulverized in a mortar. A sample of the powdered ascorbic acid weighing 0.4610-g was placed in an iodine flask and was dissolved in 50-mL H2SO4 then 5-g of KBr was added to the resulting solution. The solution was titrated with 46.73-mL of 0.0152 M STD. KBrO3 to reach a faint yellow endpoint then 3-g KI and 5-mL Starch TS. The blue color solution is then titrated with 2.78-mL of 0.1047 M STD. Na2S2O3 to reach the disappearance of the blue iodostarch complex. MW: KBrO3 = 167.0 ; KIO3 = 214.0 ; Na2S2O3 = 158.11 ; C6H8O6 = 176.12 Compute the milligrams of pure AA per tablet from the assay. None of the choices 349.7 mg 264.3 mg 462.7 mgarrow_forward
- A researcher reconstituted a vial of 750 mg Cefuroxime Sodium Powder for Injection with 6mL of sterile water for injection. The reconstituted solution was dark amber-colored solution. The package insert states that solution colors range from clear to yellow depending on concentration, diluent, and storage conditions. The researcher was then hesitant to give the patient the solution due to its unusual dark color. Five portions were taken from a batch of cefuroxime sodium. Prior to testing in the instrument, each part was subjected to one of the following conditions: Conditions Specifications Temperature Portion 1: 8°C ± 2°C Portion 2: 30°C ± 2°C Portion 3: 40°C ± 2°C Light Portion 4: Kept in the dark Portion 5: Exposed to direct sunlight 1. Of the several solutions prepared, which absorbance value results should be compared with each other to answer the questions of the pharmacist? Explain your answer.arrow_forwardA student determined the chloride content of a commercial salt by using the Mohr method. A 0.7725 -g sample of the salt was dissolved in distilled water and diluted to a final volume of 250. mL. A 25.-mL aliquot of the analyte solution was then titrated against a standard 0.0347 M AgNO3(aq) solution to the chromate end-point. A blank-corrected volume of 25.96 mL was recorded. Calculate the percent chloride in the sample.arrow_forwardAn sample of eggshell that weighs 1.0014g and is 51μm thick is titrated with disodium EDTA. A solution of the 1.0014g sample and 30 mL of HCl is vacuum filtered after being mixed. The product of the filtration is added to a 250mL volumetric flask and is diluted by being filled to the 250 mL mark with deionized water. 10 mL of this diluted mixture is mixed with EBT indicator and titrated with 0.05 M disodium EDTA. It takes 12.3 mL of disodium EDTA to notice a change in color. What percent mass of calcium is in the eggshell?arrow_forward
- Identify and explain the mistakes made in the following laboratory protocols: A 1250 mg sample of NaOH was weighed using an analytical balance. The pellets were directly transferred in the balance pans, pellets were gradually added until the reading of the balance was near to 0.2000 mg.arrow_forwardCHARACTERIZATION OF A WEAK ACID In this experiment, we shall perform a titration of an unknown weak acid (HX(aq)) with NaOH (aq) a strong base. The net ionic equation of the titration reaction is: HX(aq) + OH(aq) à H,O(I) + X(aq) The identity of the unknown can be determined by comparing its experimental molecular weight and pKa to the molecular weights and pKa of the weak acids shown in the table I. EXPERIMENT Determination of Molecular weight: Approximately 0.3 grams of unknown acid is dissolved in 70.0 mL deionized water. The unknown acid solution is then titrated with 0.123 M NaOH (aq). 50 • Initial volume of NaOH in the burette = mL 32 • Final volume of NaOH in the burette = mL • Volume of NaOH used to complete the titration = Number of moles of NaOH added = 13 135.50 g/mol • Number of moles of unknown acid present MOLECULAR WEIGHT OF UNKNOWN ACID = Determination of pKa of the weak acid: 9,93arrow_forward1. It is assumed for the calibration solutions that all of the SCN is converted to FESCN2*. What would happen to the calculated Keq if this assumption were incorrect? 2. A student mixes 5.00 mL of 2.00 mM iron (III) nitrate with 5.00 mL of 2.00 mM sodium thiocyanate. The student determines that the concentration of FeSCN2* is 1.05x10⁴ M. Calculate Keg-arrow_forward
- The ethyl acetate concentration in an alcoholic solution was determined by diluting a 10.00-mL sample to 100.00 mL. A 19.00-mL portion of the diluted solution was refluxed with 40.00 mL of 0.04601 M KOH: CH3 СОО С2H; + ОН — СH3 COO + C2H; ОН After cooling, the excess OH was back-titrated with 3.02 mL of 0.05056 M H2 SO4. Calculate the amount of ethyl acetate (88.11 g/mol) in the original sample in grams. Amount of ethyl acetate =arrow_forwardA 5.00 mL aqueous sample containing hydrogen peroxide was diluted to 25 mL and analyzed by titration with permanganate: 2MnO4- + 5H2O2 + 6H+ → 5O2 + 2Mn2+ + 8H2O The sample required 42.8 mL of 0.0175 M permanganate to reach the end point. What is the concentration of hydrogen peroxide in the original sample?arrow_forwardA 4.932-g sample of a petroleum product was burned in a tube furnace, and the SO2 produced was collected in 3% H2 O2. Reaction: SO2 (9) + H2 O2 → H2SO4 A 28.00-mL portion of 0.00878 M NaOH was introduced into the solution of H2SO4, following which the excess base was back-titrated with 15.27 mL of 0.01160 M HCI. Calculate the sulfur concentration in the sample in parts per million. Concentration = ppmarrow_forward
 Chemistry & Chemical ReactivityChemistryISBN:9781337399074Author:John C. Kotz, Paul M. Treichel, John Townsend, David TreichelPublisher:Cengage Learning
 Chemistry & Chemical ReactivityChemistryISBN:9781133949640Author:John C. Kotz, Paul M. Treichel, John Townsend, David TreichelPublisher:Cengage Learning
 Chemistry: Principles and PracticeChemistryISBN:9780534420123Author:Daniel L. Reger, Scott R. Goode, David W. Ball, Edward MercerPublisher:Cengage Learning