
(a)
Interpretation:
Estimation of parameters a, b and c from the given equation and data of composition versus excess enthalpy.
Concept introduction:
Excess molar properties of mixtures are the non ideal nature of real mixtures. They are generally the difference between the partial molar property of a component in a real mixture and in an ideal mixture.
Parameters a, b and c can be determined by fitting the data given in the question.
(a)
Answer to Problem 10.33P
Parameters of the given equations are:
Explanation of Solution
We know that the mole fraction of the second component in a mixture can be written as
Which reduces the given equation of excess volume as:
For calculating parameters using the best fit metod of data to the equation, we must assume initial parameters as:
a = -500 ; b = -100 and c = 0.1
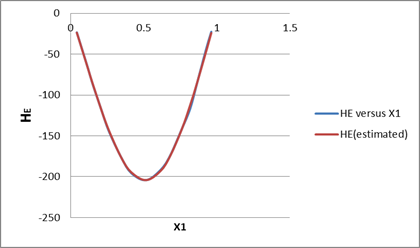
Now we will estimate values of HE using given equation and assumed parameters and find the error using formula given below:
After finding error, we have to minimize the error to best fit the given and estimated data by finding parameter in excel solver as described below:
| x1 | HE(given) | HE(estimated) | Normalized error |
| 0.0426 | -23.3 | -23.2149 | 0.000255 |
| 0.0817 | -45.7 | -45.633 | 0.00011 |
| 0.1177 | -66.5 | -66.6008 | 6.04E-05 |
| 0.151 | -86.6 | -85.833 | 4.78E-05 |
| 0.2107 | -118.2 | -118.781 | 1.08E-06 |
| 0.2624 | -144.6 | -144.559 | 5.81E-05 |
| 0.3472 | -176.6 | -178.669 | 9.94E-07 |
| 0.4158 | -195.7 | -196.933 | 2.64E-05 |
| 0.5163 | -204.2 | -206.209 | 1.4E-08 |
| 0.6156 | -191.7 | -193.963 | 4.17E-05 |
| 0.681 | -174.1 | -174.738 | 1.05E-05 |
| 0.7621 | -141 | -140.126 | 3.45E-06 |
| 0.8181 | -116.8 | -110.579 | 0.001453 |
| 0.865 | -85.6 | -83.2654 | 1.4E-05 |
| 0.9276 | -43.5 | -44.7103 | 0.004488 |
| 0.9624 | -22.6 | -23.0104 | 0.004457 |
| Sum of error | 0.011027 | ||
| Estimated | Assumed | ||
| a | -530 | -500 | |
| b | -1129 | -100 | |
| c | 1050 | 0.1 |
By the linear fitting of the given data in the given equation, we will get parameters as:
(b)
Interpretation:
Estimation the minimum value of excess enthalpy and composition at which it becomes minimum.
Concept introduction:
Excess molar properties of mixtures are the non ideal nature of real mixtures. They are generally the difference between the partial molar property of a component in a real mixture and in an ideal mixture.
(b)
Answer to Problem 10.33P
Minimum value of excess enthalpy = -204.4 J/mol at composition 0.512.
Explanation of Solution
We know that the mole fraction of the second component in a mixture can be written as
Which reduces the given equation of excess enthalpy as:
Put the determined parameter values from part (a) to the equation (1), we get:
Now differentiate above equation with respect to x1 and equate it to zero gives:
Now we will find the value of x1 which satisfies the above equation:
Let x1 = 0.5
Near to zero, so composition will be approximately 0.5 or 0.513.
So, at x1 = 0.513 excess enthalpy will be a minumum and the minimum value of excess enthalpy can be calculated as given below:
(c)
Interpretation:
Derive expression for
Concept introduction:
Excess molar properties of mixtures are the non ideal nature of real mixtures. They are generally the difference between the partial molar property of a component in a real mixture and in an ideal mixture.
Partial molar properties can be derived from equations:
(c)
Answer to Problem 10.33P
Expression of partial molar properties is:
The graph plotted between partial molar properties and composition.
Explanation of Solution
We know that the mole fraction of the second component in a mixture can be written as
Which reduces the given equation of excess enthalpy as:
Put the determined parameter values from part (a) to the equation (1), we get:
Now differentiate the above equation with respect to x1 and get:
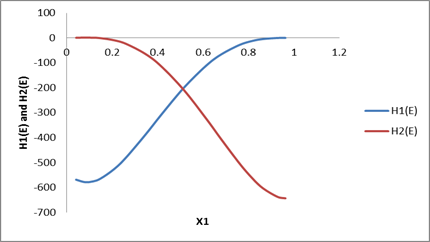
The expression for partial molar enthalpy can be written as follows:
Plot of partial molar properties derived above with x1 can be drawn as follows:
We know that,
So, the partial molar equations become:
| x1 | HE | H1(E ) | H2(E ) |
| 0.0426 | -23.3 | -568.736 | 0.760504 |
| 0.0817 | -45.7 | -584.771 | 1.762019 |
| 0.1177 | -66.5 | -585.497 | 1.796789 |
| 0.151 | -86.6 | -576.017 | 0.291058 |
| 0.2107 | -118.2 | -539.462 | -7.96384 |
| 0.2624 | -144.6 | -492.7 | -22.5599 |
| 0.3472 | -176.6 | -398.129 | -64.4174 |
| 0.4158 | -195.7 | -315.445 | -115.569 |
| 0.5163 | -204.2 | -200.304 | -216.279 |
| 0.6156 | -191.7 | -107.319 | -337.296 |
| 0.681 | -174.1 | -61.7537 | -421.072 |
| 0.7621 | -141 | -23.8448 | -518.49 |
| 0.8181 | -116.8 | -8.90102 | -574.265 |
| 0.865 | -85.6 | -2.30111 | -608.877 |
| 0.9276 | -43.5 | 0.450114 | -630.781 |
| 0.9624 | -22.6 | 0.303215 | -627.571 |
Plot drawn according to data calculated in the above table as:
Want to see more full solutions like this?
Chapter 10 Solutions
GEN, ORG & BIOL CHEM: CUSTOM SSC

 Introduction to Chemical Engineering Thermodynami...Chemical EngineeringISBN:9781259696527Author:J.M. Smith Termodinamica en ingenieria quimica, Hendrick C Van Ness, Michael Abbott, Mark SwihartPublisher:McGraw-Hill Education
 Elementary Principles of Chemical Processes, Bind...Chemical EngineeringISBN:9781118431221Author:Richard M. Felder, Ronald W. Rousseau, Lisa G. BullardPublisher:WILEY
 Elements of Chemical Reaction Engineering (5th Ed...Chemical EngineeringISBN:9780133887518Author:H. Scott FoglerPublisher:Prentice Hall
 Industrial Plastics: Theory and ApplicationsChemical EngineeringISBN:9781285061238Author:Lokensgard, ErikPublisher:Delmar Cengage Learning
 Unit Operations of Chemical EngineeringChemical EngineeringISBN:9780072848236Author:Warren McCabe, Julian C. Smith, Peter HarriottPublisher:McGraw-Hill Companies, The